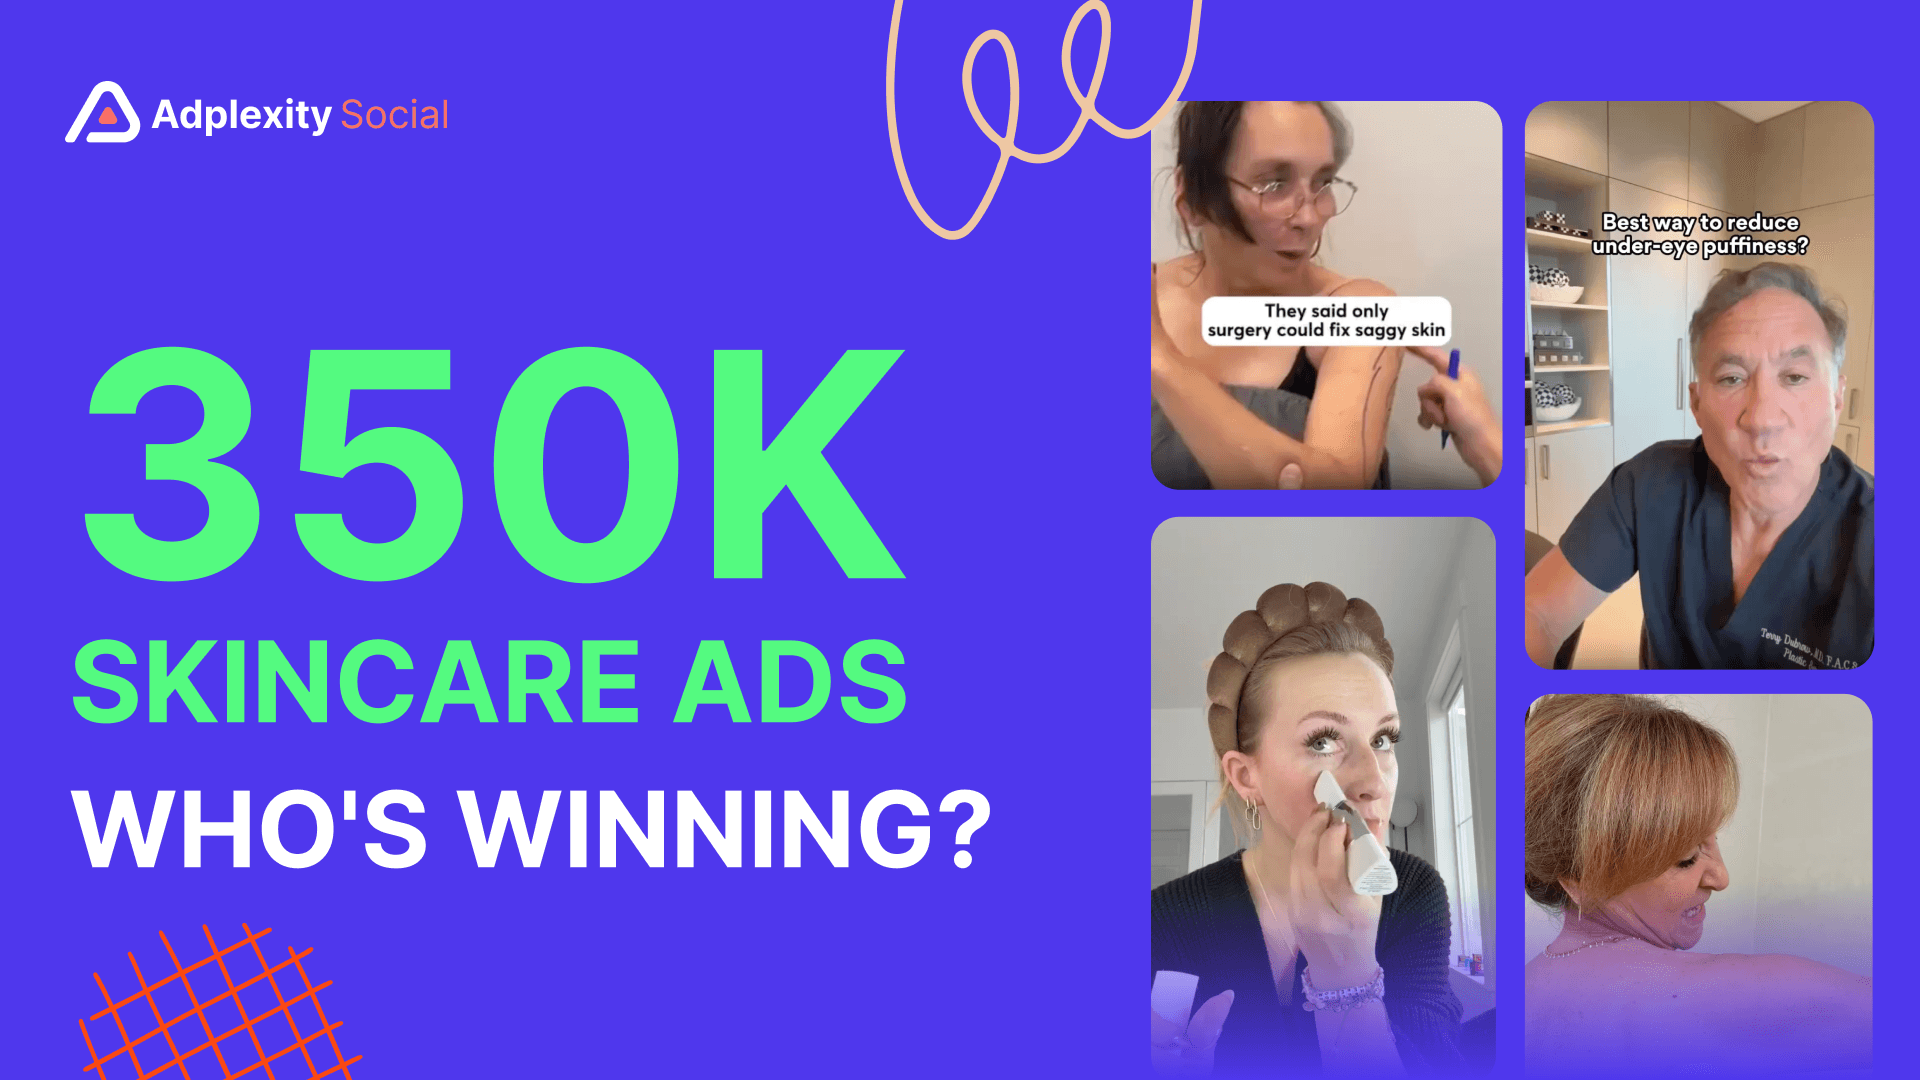
How to Find Winning Skincare Facebook Ads: 350,000 Ads Analyzed

Share:
Key Takeaways: The skincare vertical on Meta is massive — nearly 350,000 ads in 30 days, with almost 50% targeting the US, and Shopify dominating the tech stack.
The brands scaling hardest right now rely on long-form video creatives (often 1–6 minutes), split between UGC-style content and doctor/authority figure formats, and they're driving traffic to a mix of product pages and advertorials.
The real signal isn't just who's running the most ads — it's who's actively launching new ones while keeping existing creatives alive.
Watch the full tutorial on YouTube: https://www.youtube.com/watch?v=oKir_Z0i36k
Skincare is one of those verticals where everybody knows there's money, but most people have no idea what the winning campaigns actually look like.
They'll scroll through the Facebook Ads Library, see a few ads from brands they already know, and call it "research."
That's not research. That's browsing.
I spent time pulling apart the skincare niche inside AdPlexity Social, and what I found was a lot more interesting than I expected.
We're talking 350,000 ads in the last 30 days alone — and the strategies the top brands are using are not what most people would guess.
Here's what's actually happening in skincare ads on Meta right now, and how you can use that data to find winning products, creatives, and funnel strategies in minutes.
The Skincare Niche on Meta: Bigger Than You Think
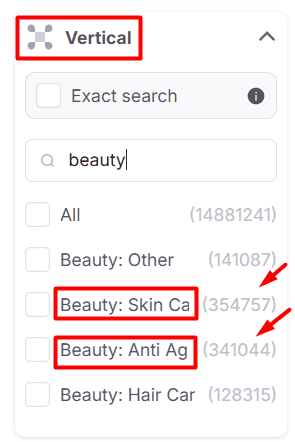
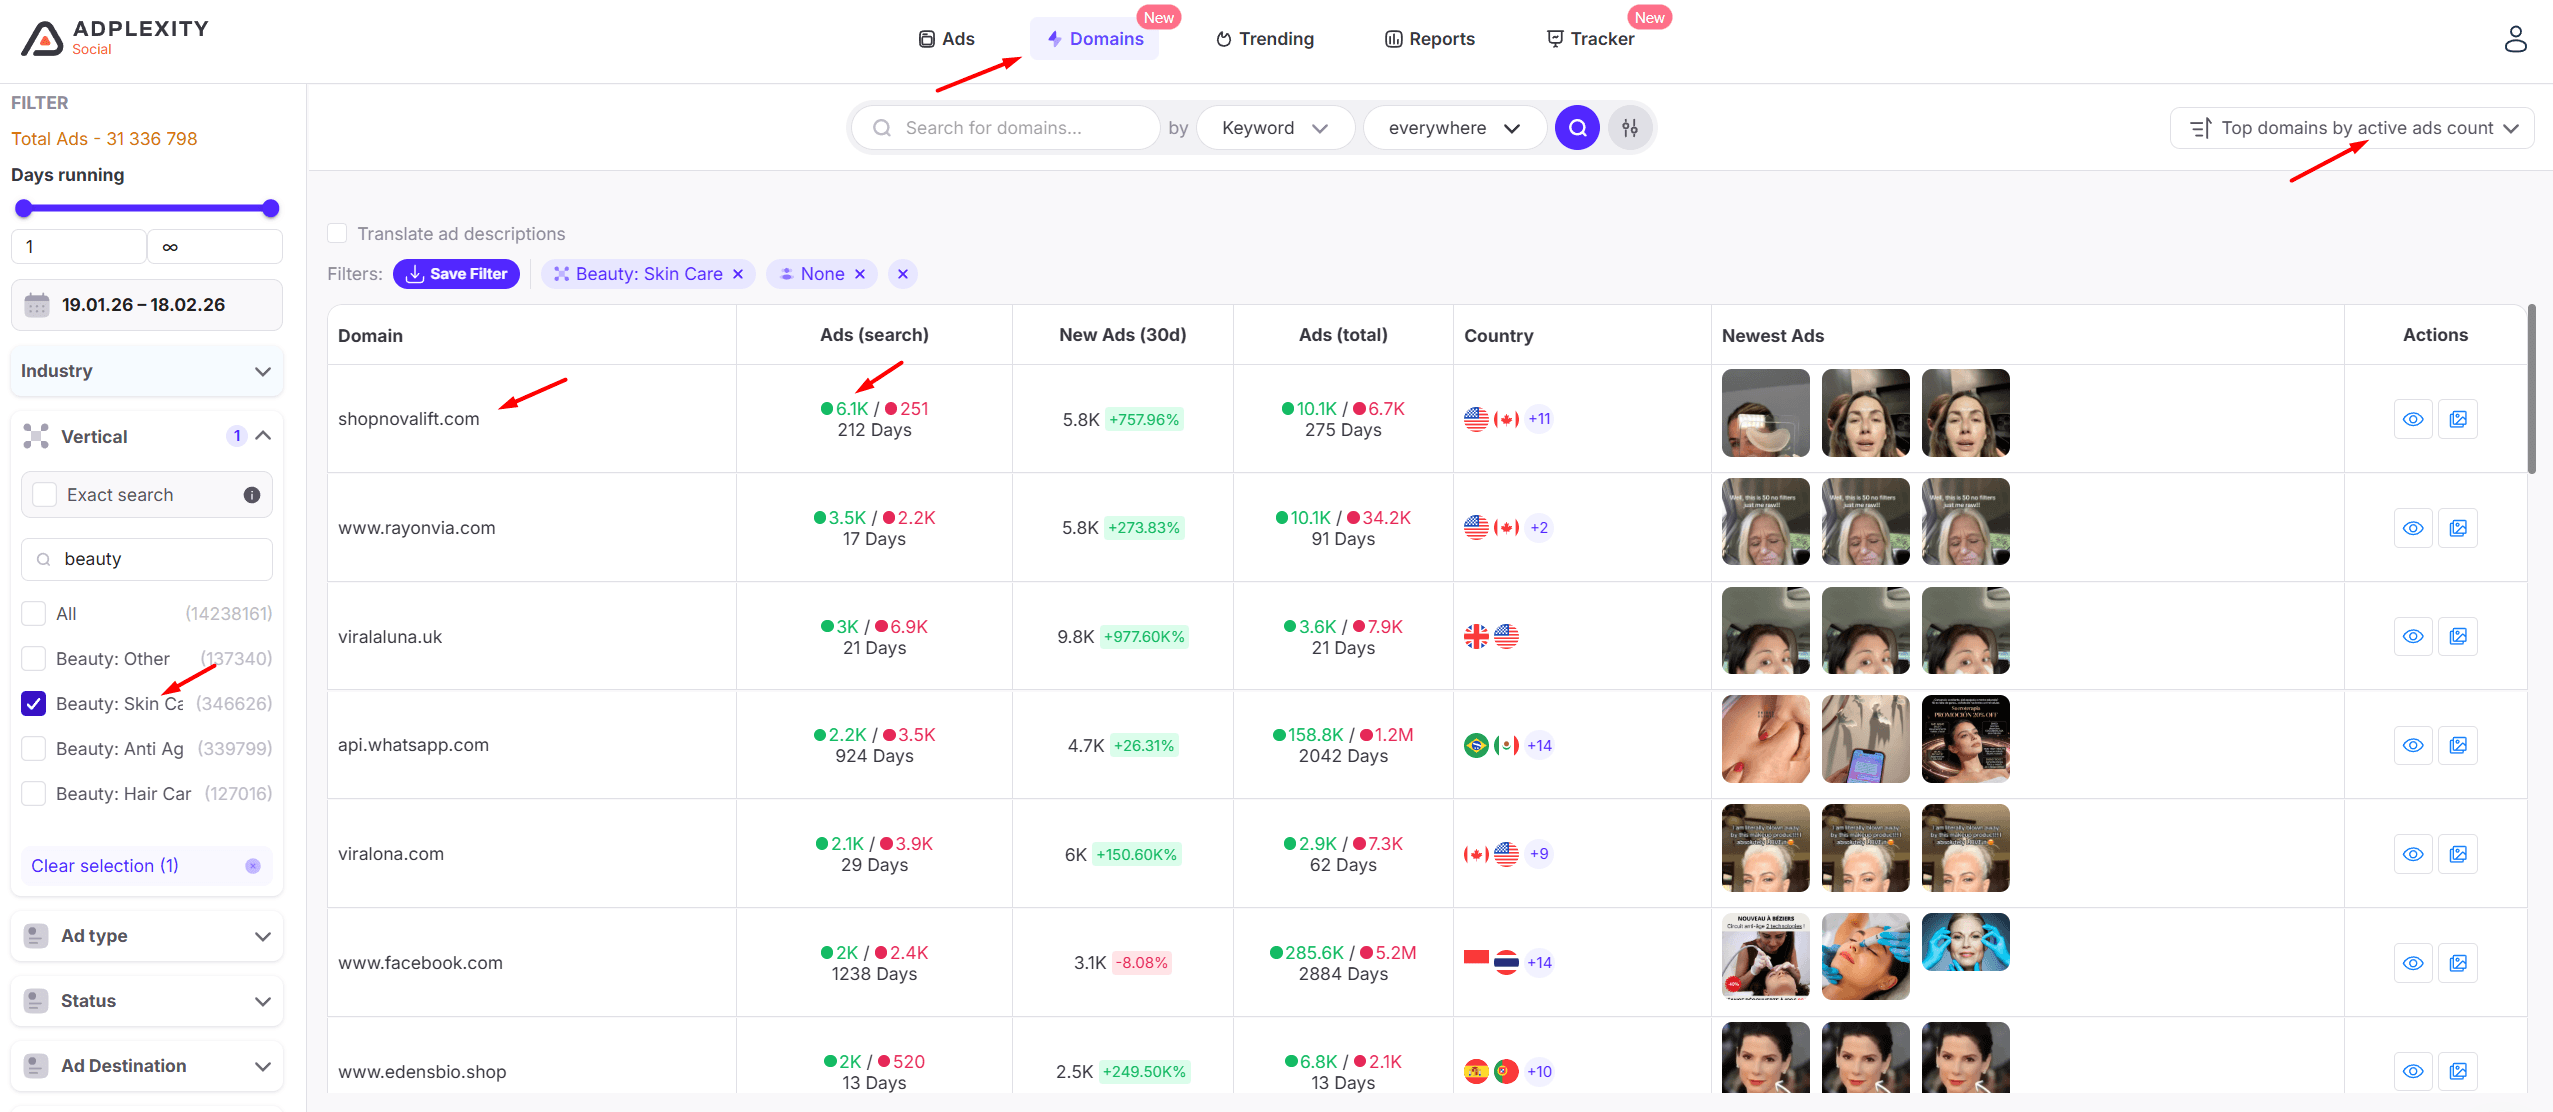
First, some context on the size of this space. When you pull up AdPlexity Social's vertical filters for skincare, you'll find two main categories that matter:
Beauty: Skincare (the broad one) and Beauty: Anti-Aging (a more specific sub-segment covering everything from Botox-adjacent products to anti-wrinkle creams). There's also Hair Care, but that's a separate conversation.
Beauty: Skincare alone returned nearly 350,000 ads in the last 30 days. That's not total ads in the database — that's just what's been running recently.
The geographic breakdown is roughly what you'd expect. Around 160,000 of those ads target the US, making it close to 50% of the total volume.
The UK follows at about 75,000, then Canada at 74,000, Australia at 66,000, and European markets like Spain, France, Germany, and Italy, hovering around 25,000 each.
If you're running skincare campaigns in any of these geos, there's more than enough data to build a competitive intelligence picture.
The tech stack data tells an interesting story too. Shopify accounts for roughly 160,000 of those ads — just under 50%.
That confirms what most people suspect: this space is dominated by ecommerce.
There's no significant affiliate network presence, which means the majority of these advertisers are DTC brands selling their own products or offering them to Affiliates directly, not affiliates pushing offers through networks.
So the playfield is set. It's a massive, ecom-heavy space with most of the action happening in English-speaking markets. Now let's find the winners.
Finding the Top Creatives: What's Actually Getting Scale
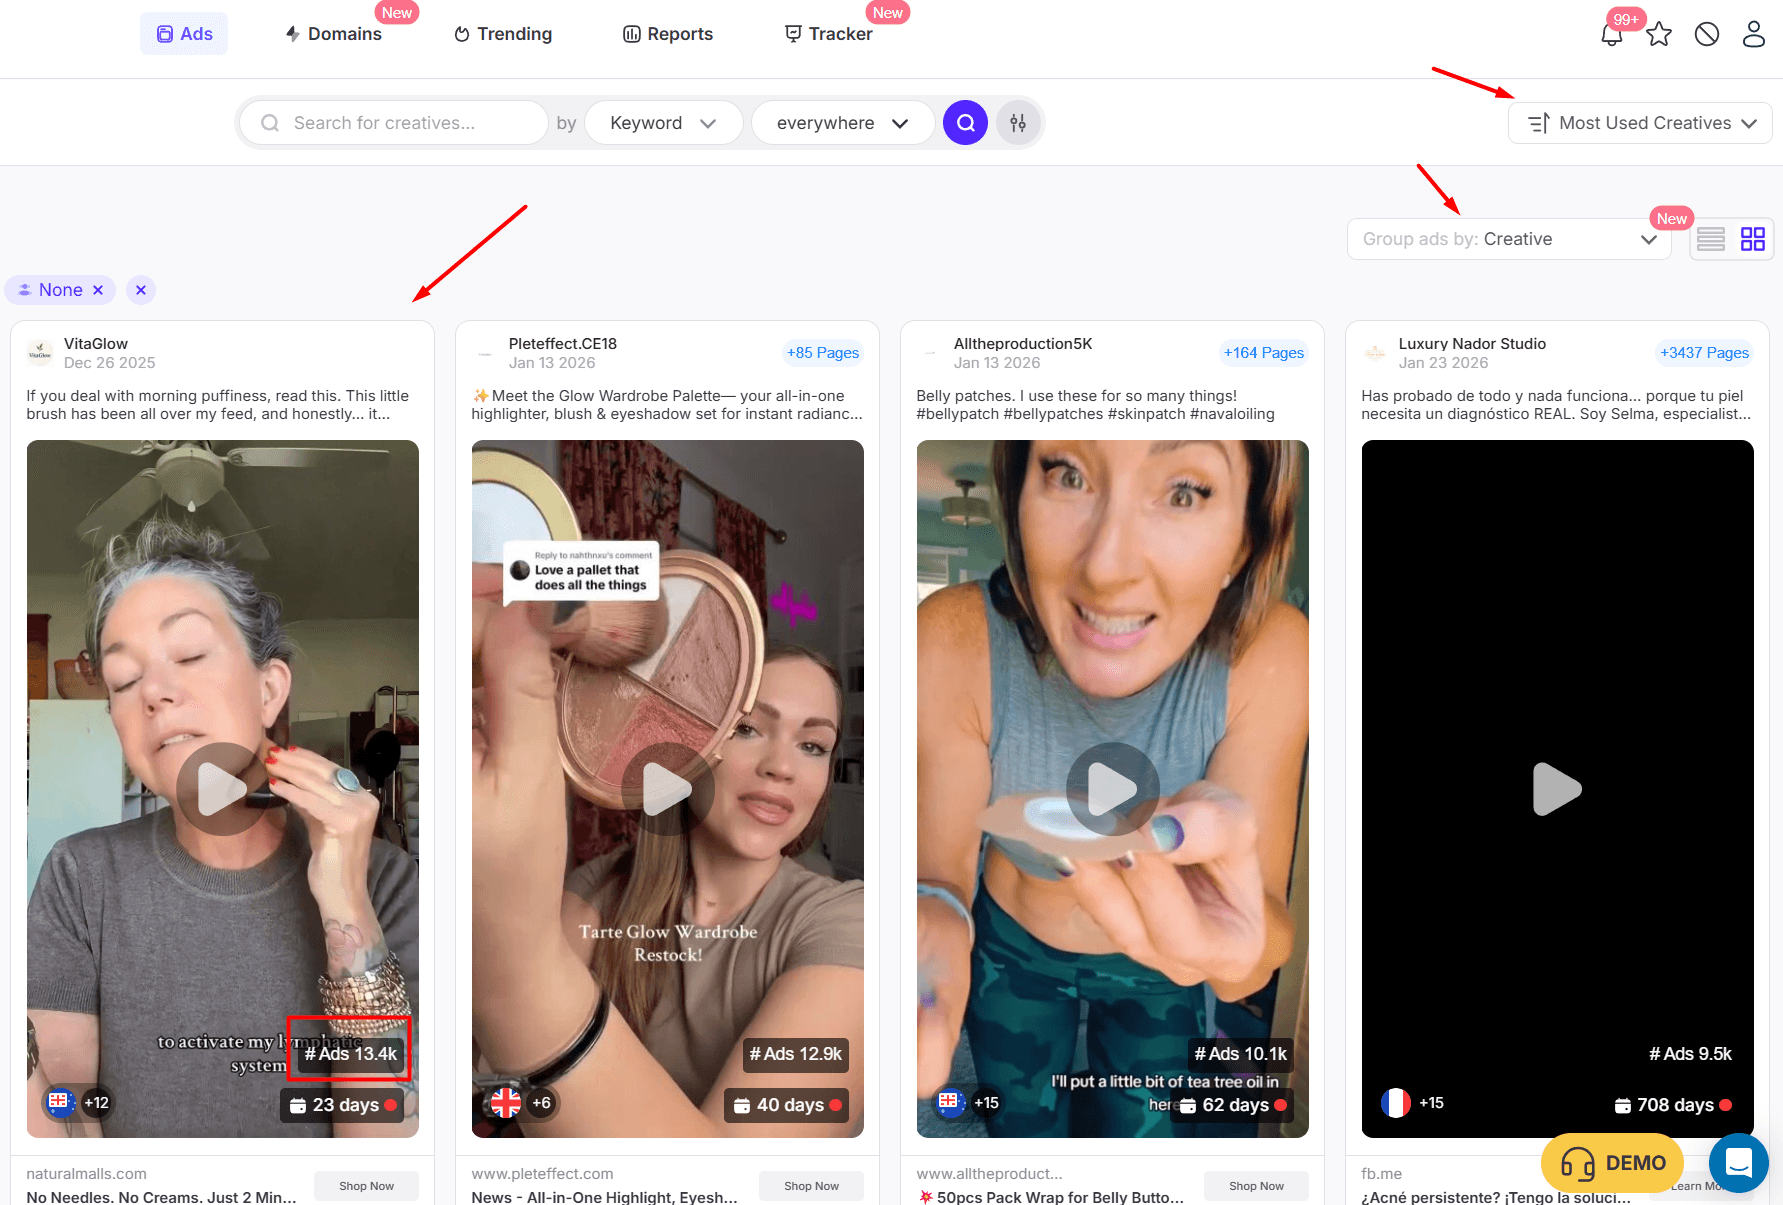
The first thing most people do is sort by the most popular creatives. That's a fine starting point, but you have to read the data carefully.
When you group ads by creative and sort by most used, you'll see some eye-popping numbers. One creative from a brand called Vitaglow showed up in over 13,000 ads — a lymphatic face brush promoted through a long-form video.
At 4 minutes and 44 seconds, it's way longer than what most media buyers would consider running. But the numbers don't lie. That single creative, linked to a Shopify store with a standard ecom product page, was deployed across thousands of ad sets.
Here's where the nuance comes in, though.
A creative with a huge total ad count might be declining. The real question is: how many of those ads are still active right now, and are they launching new ads with it?
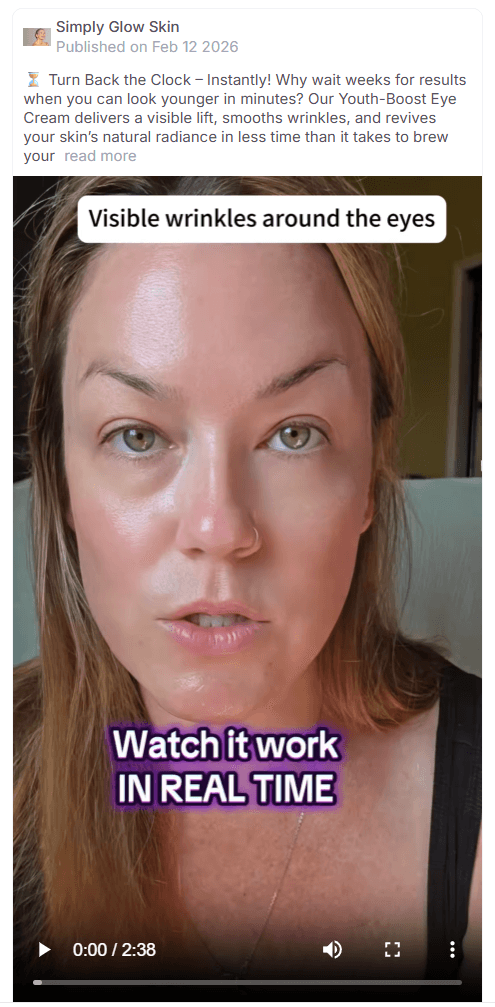
When I switched the sorting to active ads, a different picture emerged. The top active creative for one brand had 553 live ads out of 3,200 total. It was a UGC-style video — a woman talking to the camera with the product visible in the bottom corner.
The interesting detail? It was hard to tell whether the person in the video was real or AI-generated.
The production quality of AI avatars in skincare ads has gotten good enough that even on close inspection, you can't always be sure. That's a trend worth watching.
This creative is linked to a product page (not an advertorial) for an eye-lifting cream.
And the brand was using it across one Facebook fan page — a simpler setup than some of the more aggressive players we'll look at next.
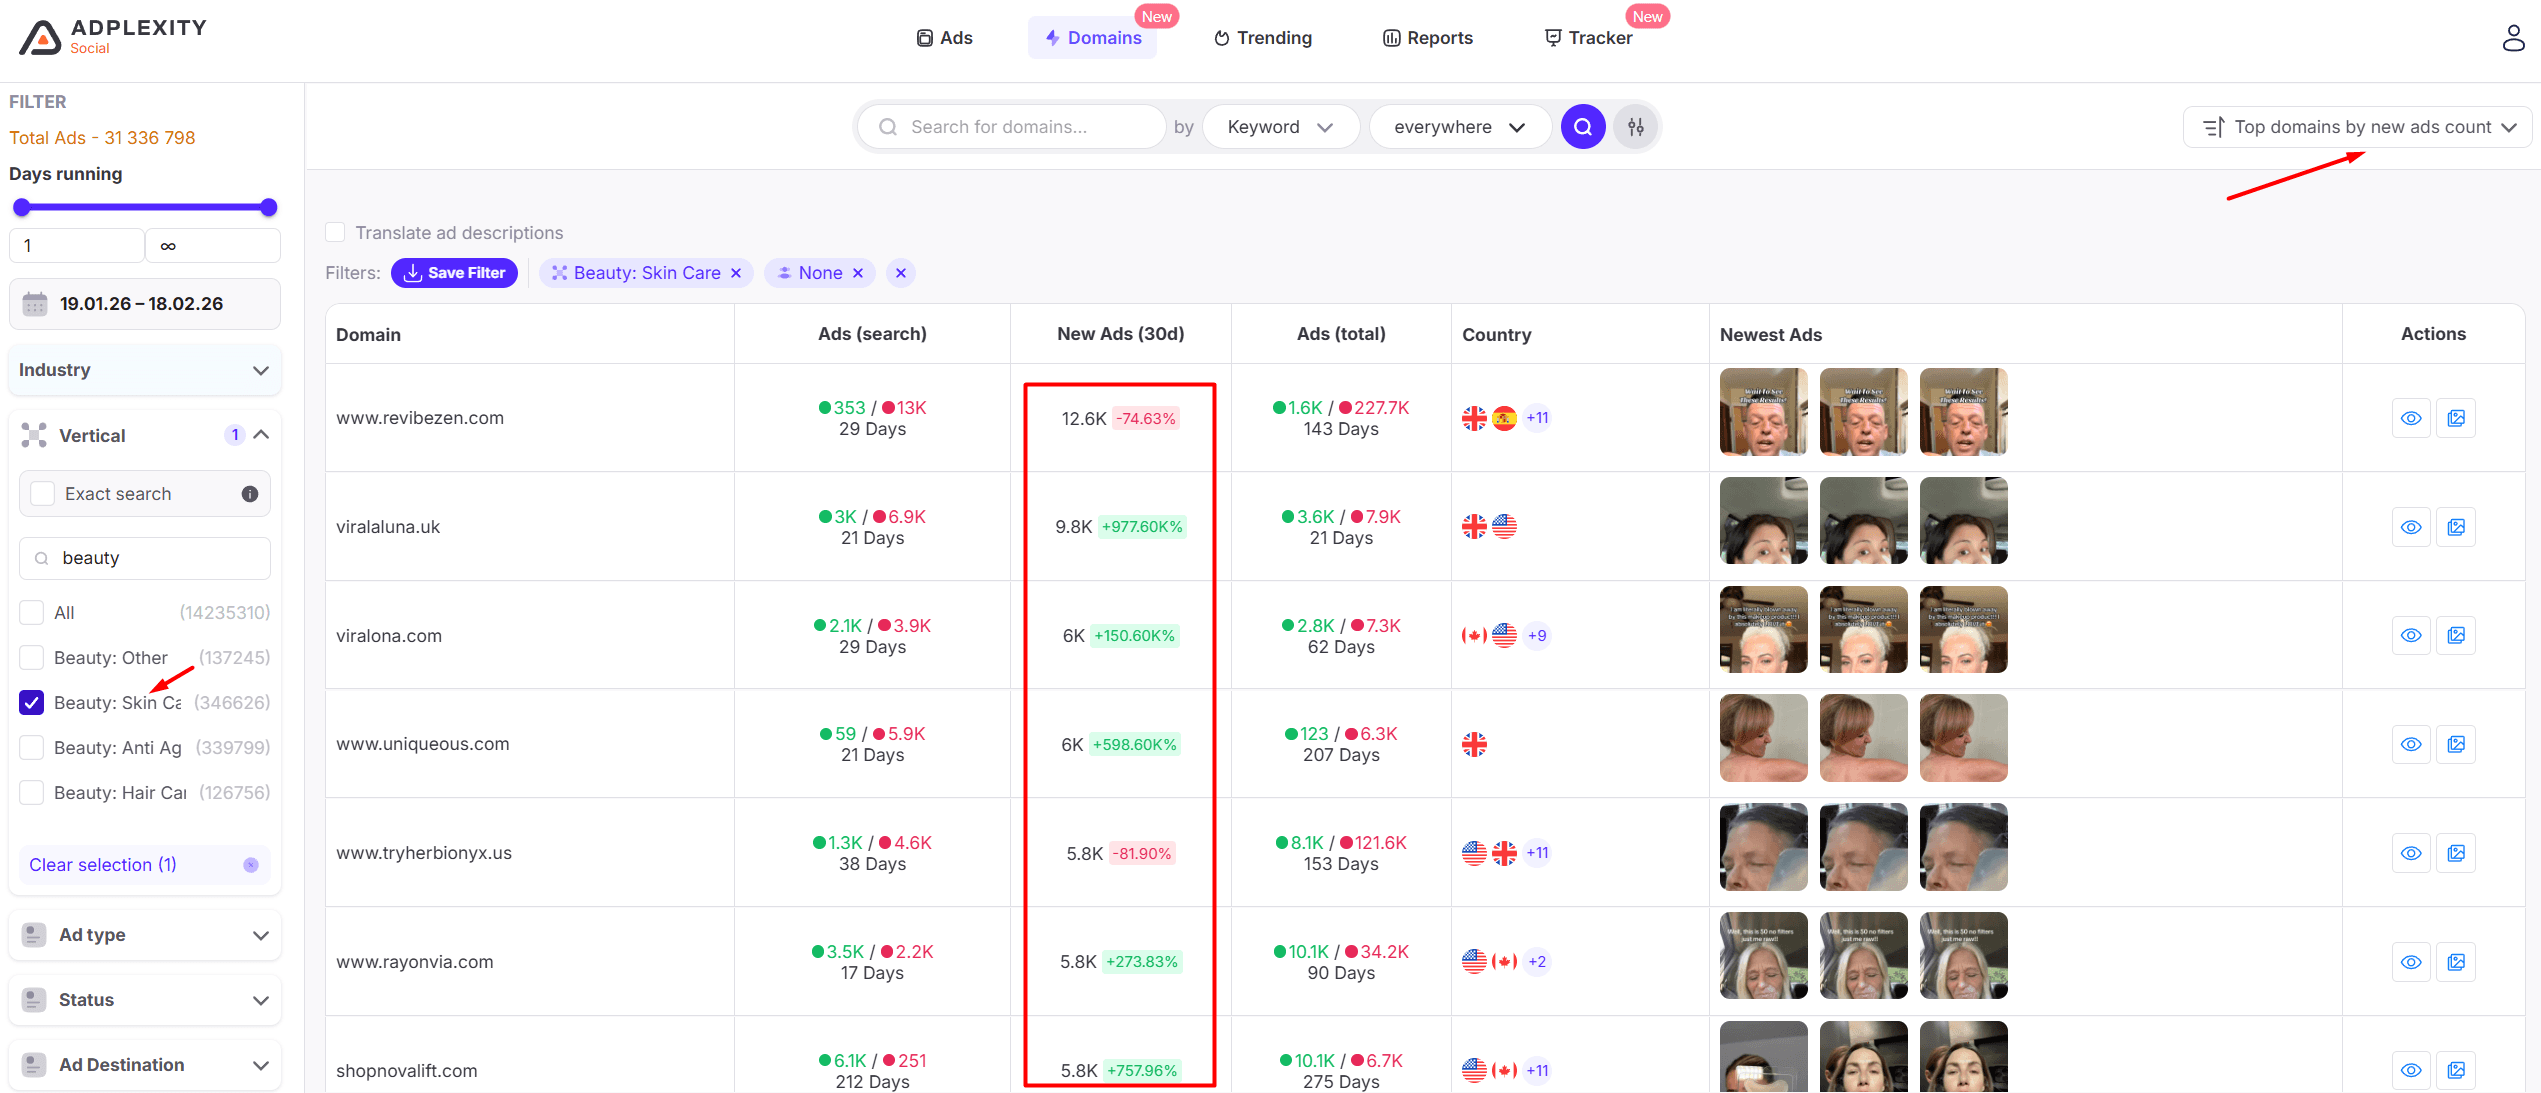
The Domain Dimension: Where the Real Intelligence Is
Browsing creatives is useful, but my preferred approach for this type of analysis is the domain dimension.
This shows you which domains — which brands and stores — are running the most ads, and more importantly, which ones are actively scaling right now.
Here's what stood out.
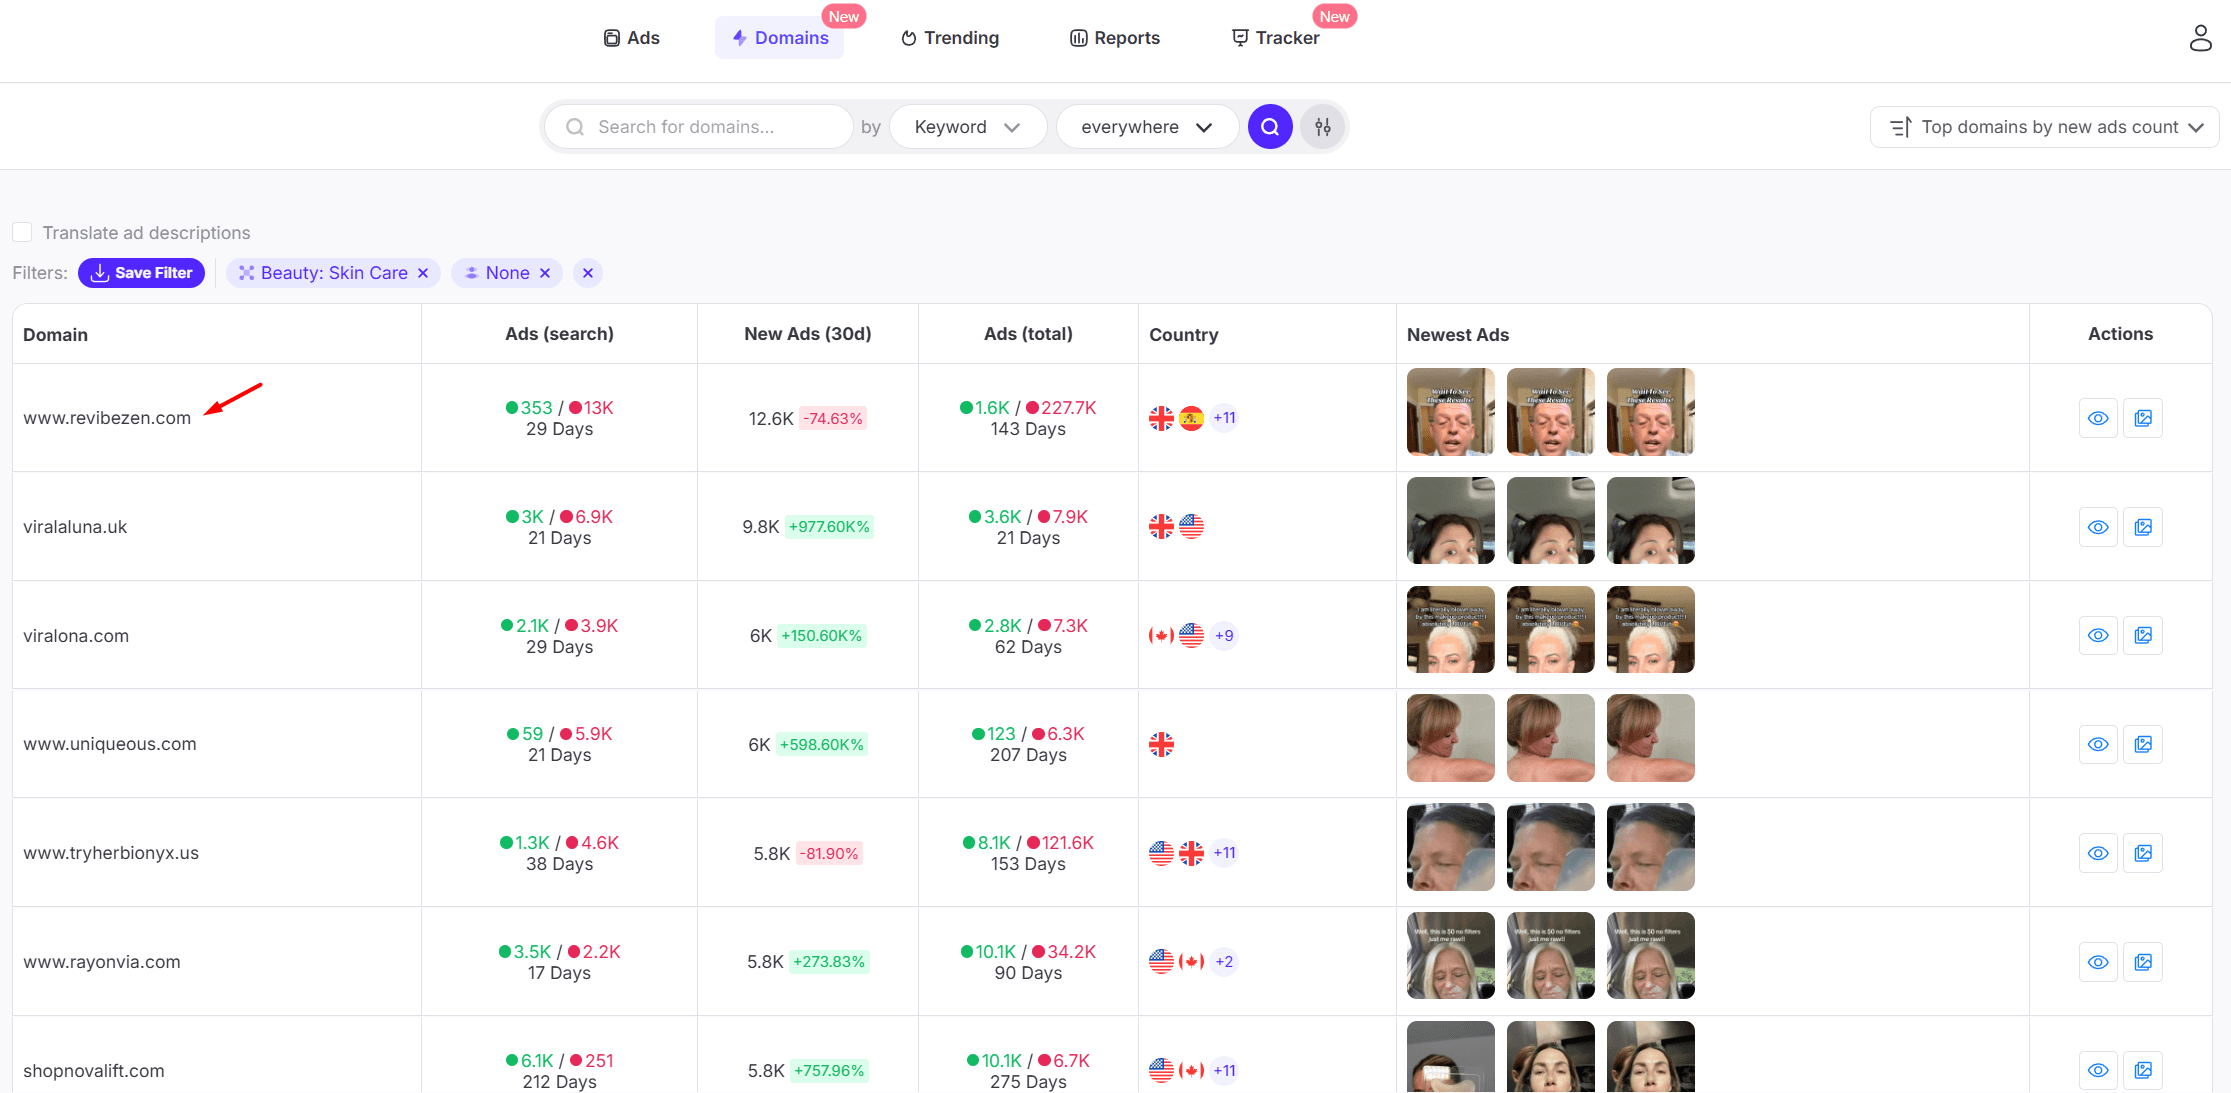
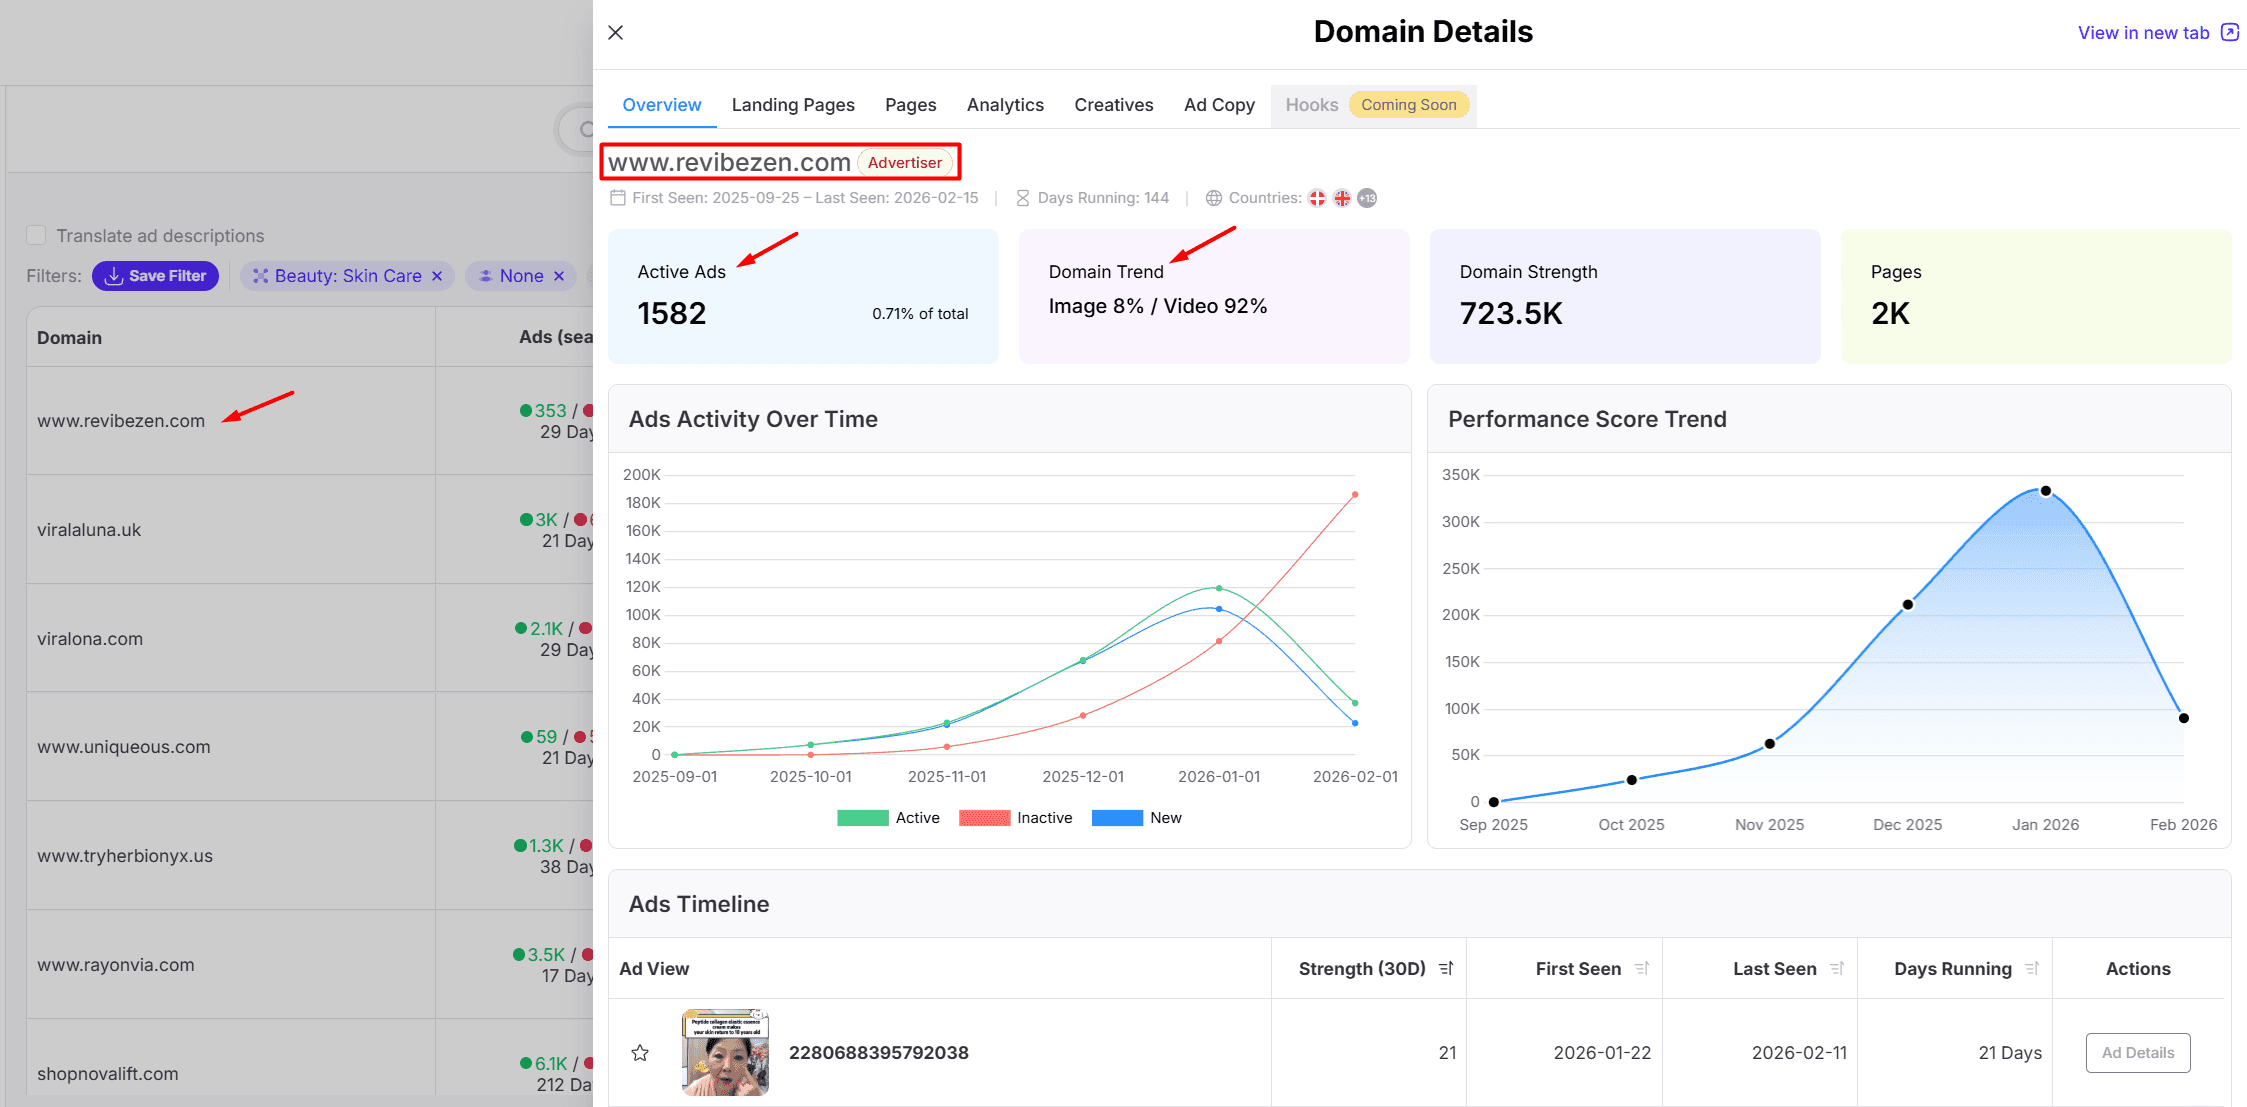
Revibezen: The Multi-Page Machine
Revibezen was one of the first domains that jumped out. They had almost 1,600 live ads at the time I checked, but their trajectory was actually downward — they were pausing more ads than they were launching.
That's important context. A brand with a lot of total ads but declining activity is a different signal than one that's ramping up.
Their product focus was eye lift cream and related skincare products, with landing pages ranging from 2,000 to 6,000 ads each.
What made them interesting from a strategy perspective was their fan page approach. Instead of running all their ads from a single branded page, they distributed them across many different fan pages.
The reason is obvious once you think about it: ads from personal-looking pages feel more native and organic in the feed than ads from a clearly branded account.
It's a tactic we've seen in other verticals, and it's very much alive in skincare.
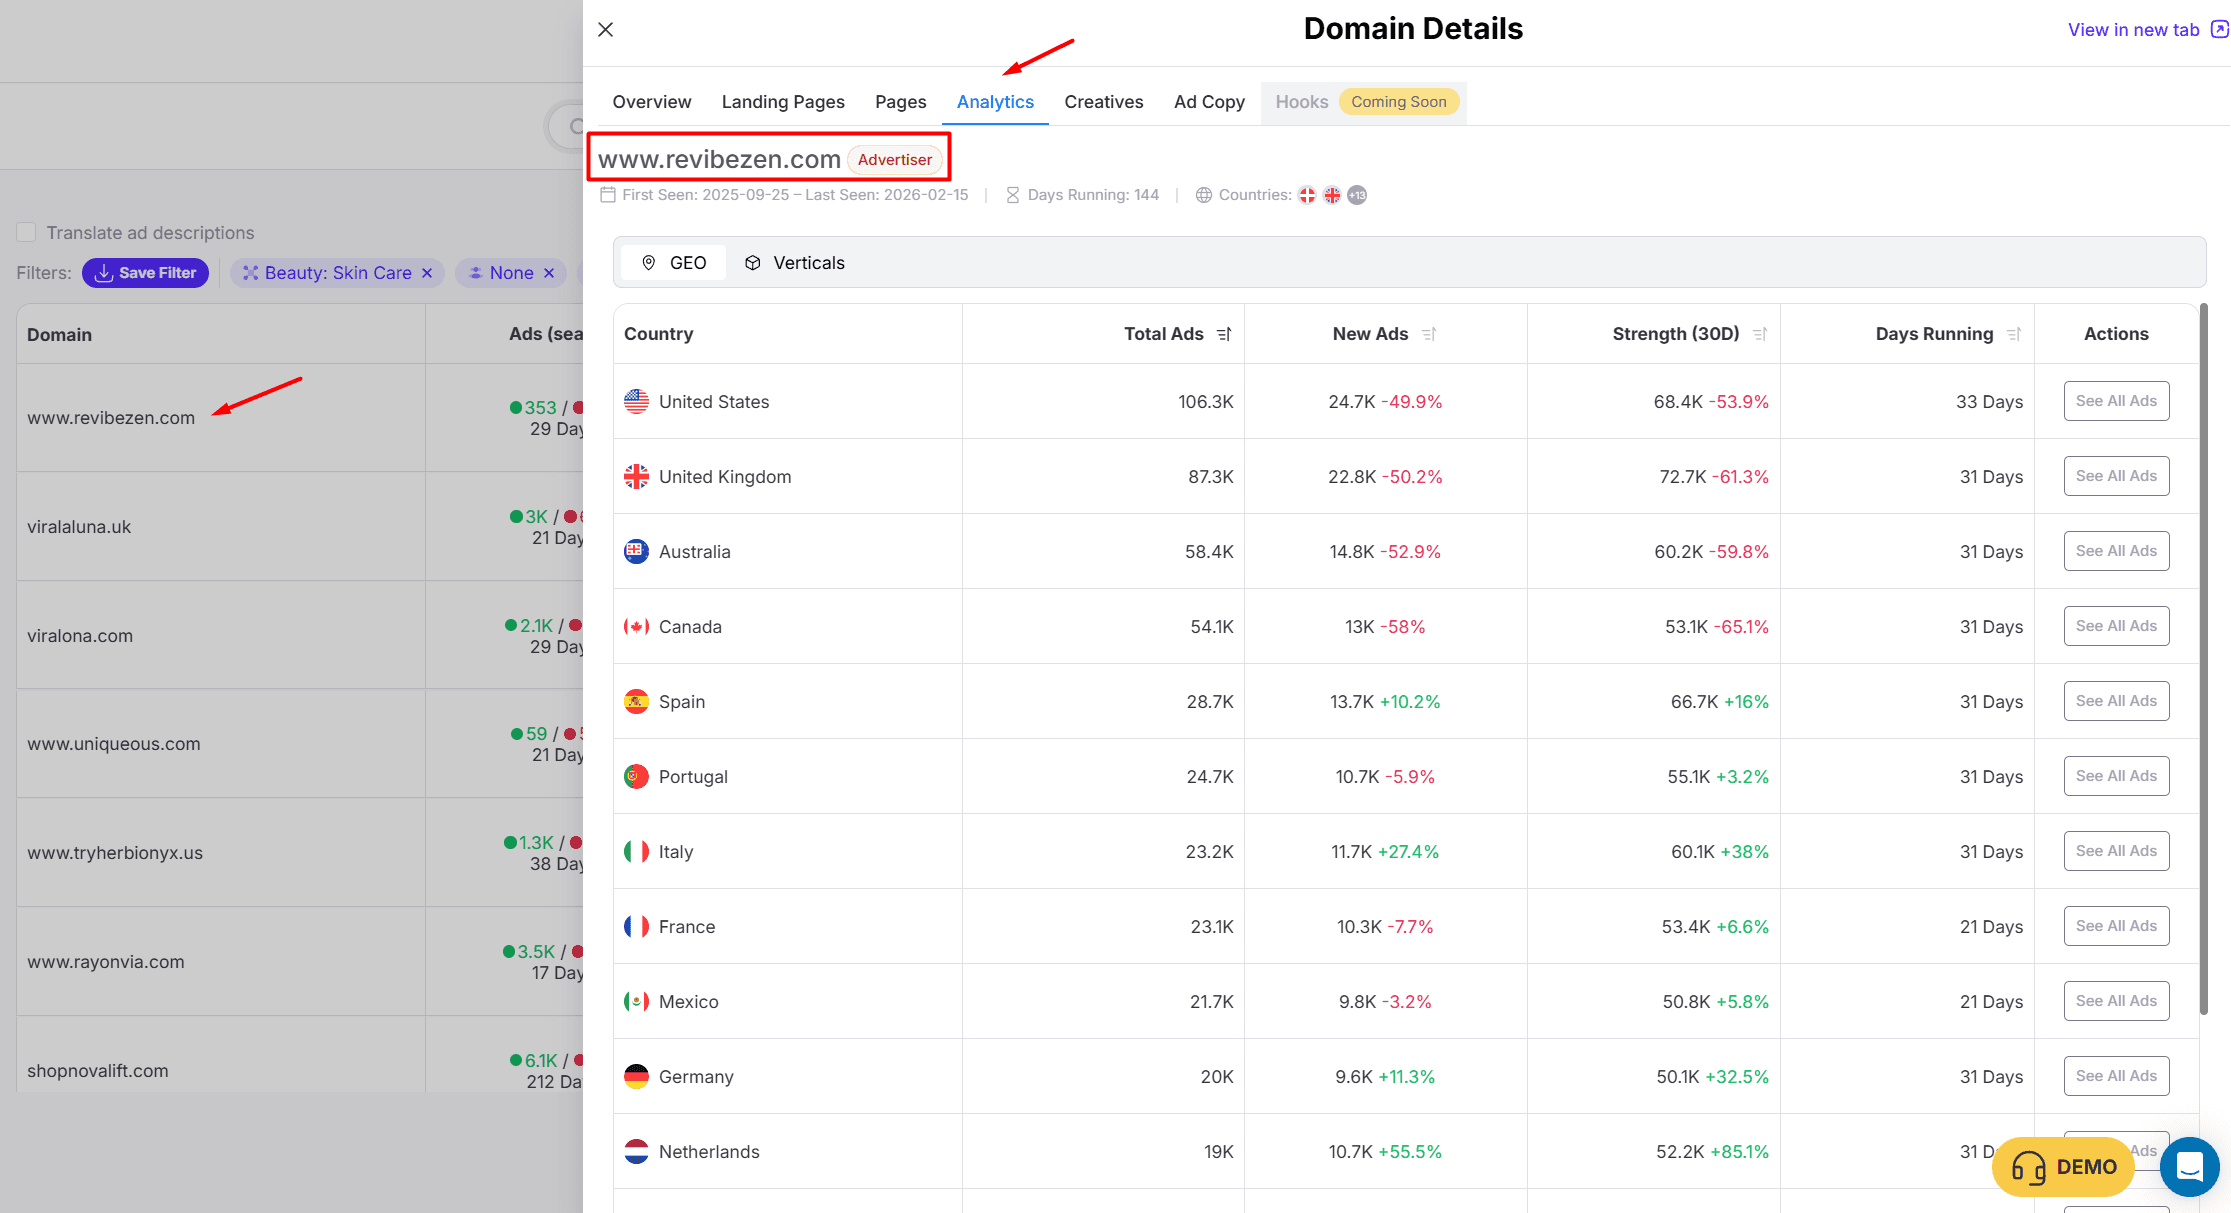
Their geographic strategy was shifting, too. The US, UK, Australia, and Canada were still their main markets, but the percentage of new ads going to those countries was declining.
Meanwhile, their European activity — Spain, Portugal, Italy, Germany, the Netherlands — was ticking up.
That's the kind of geo-expansion signal you can only see when you look at new ad launches relative to the previous period.
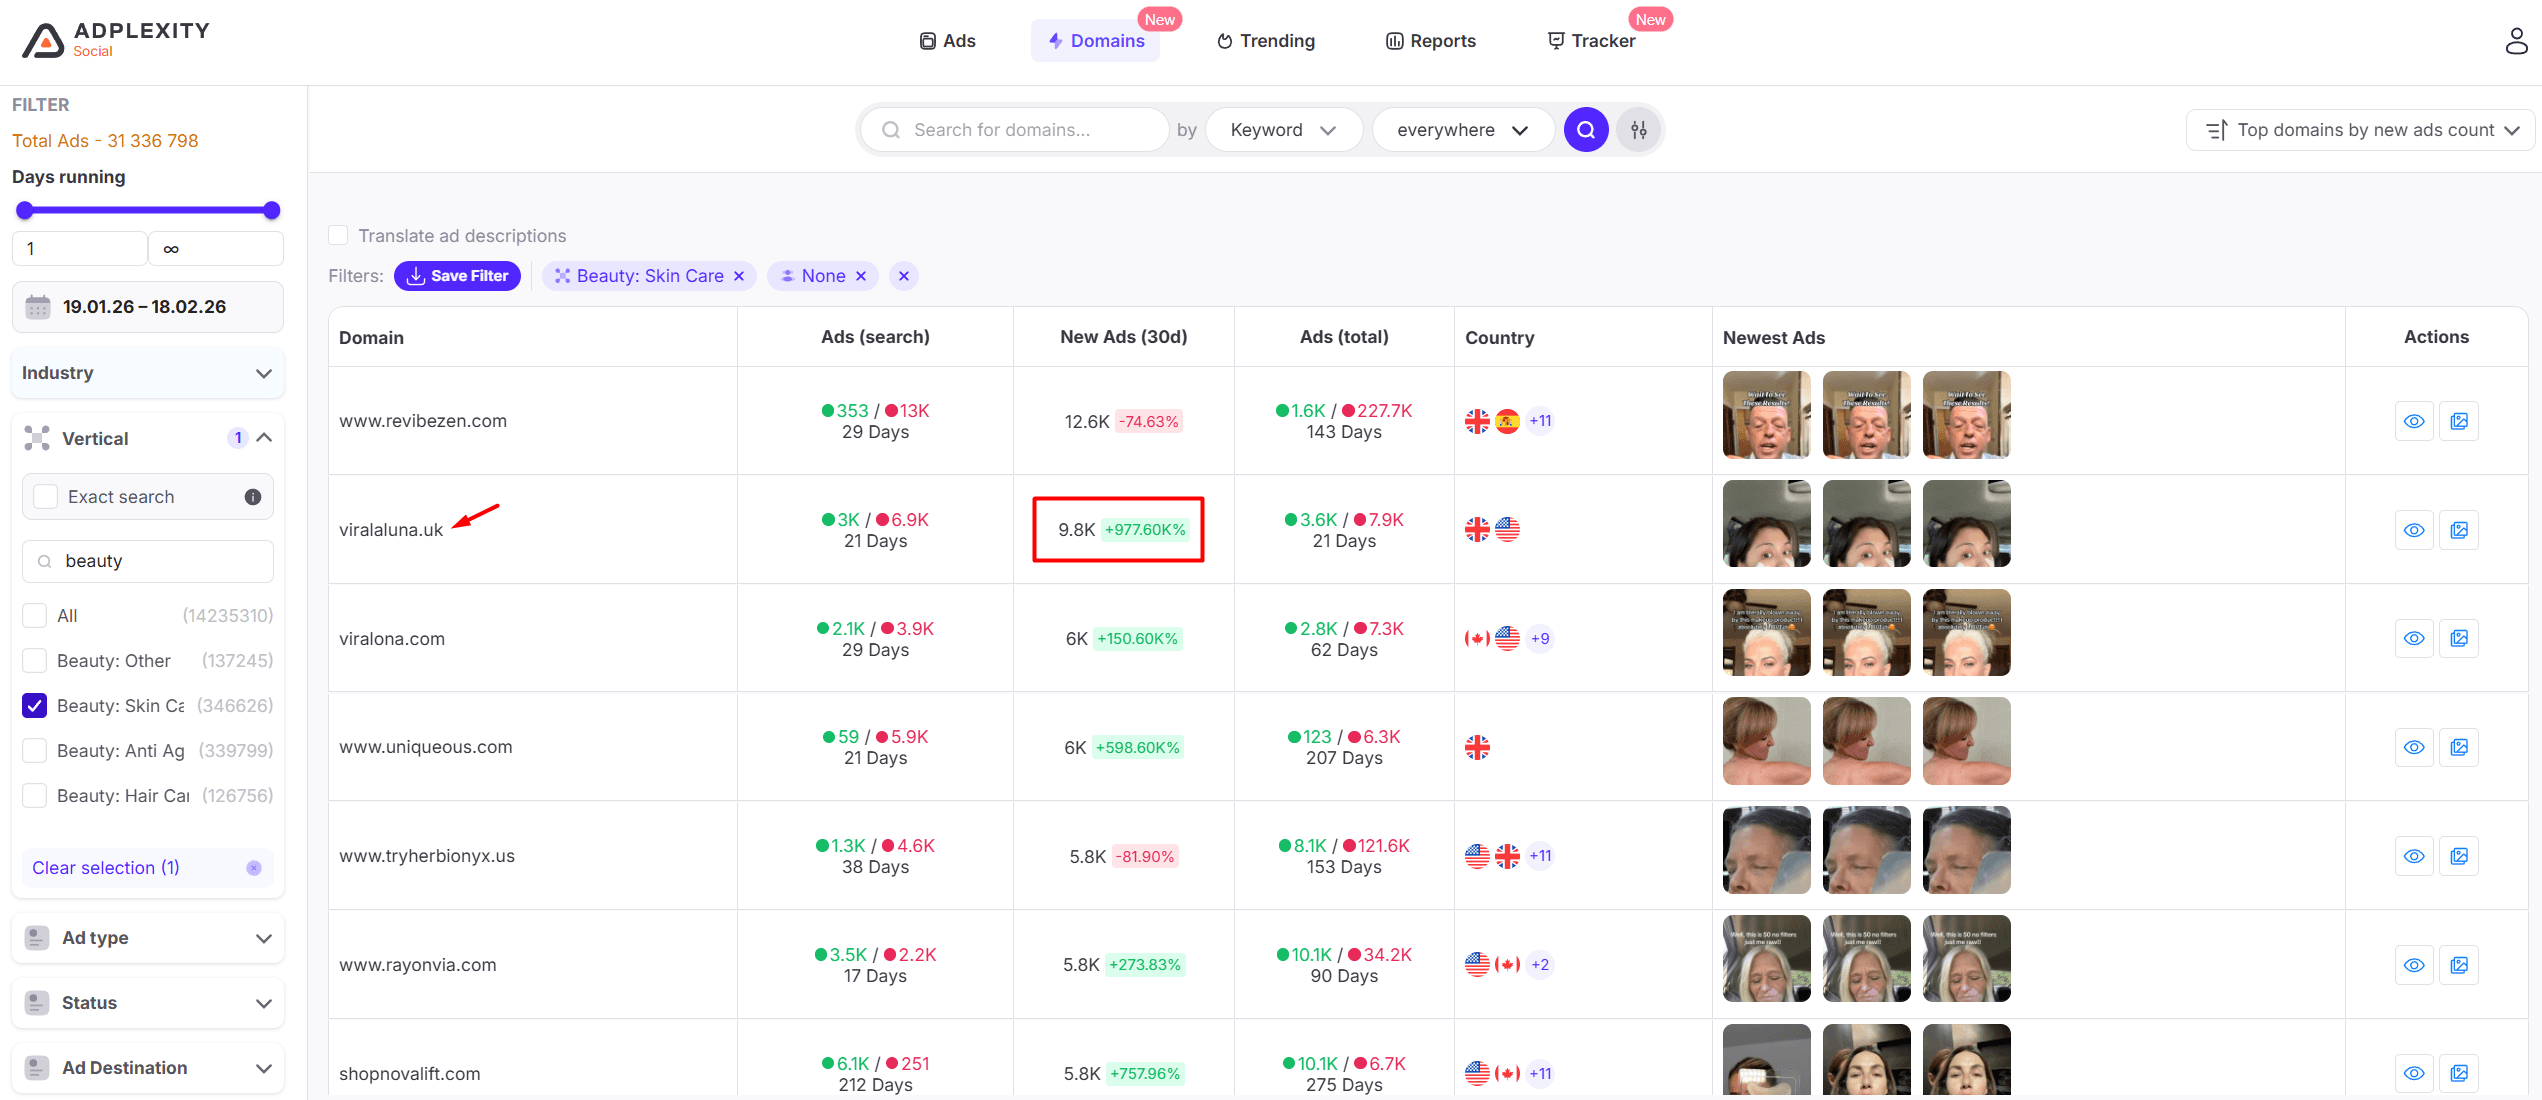
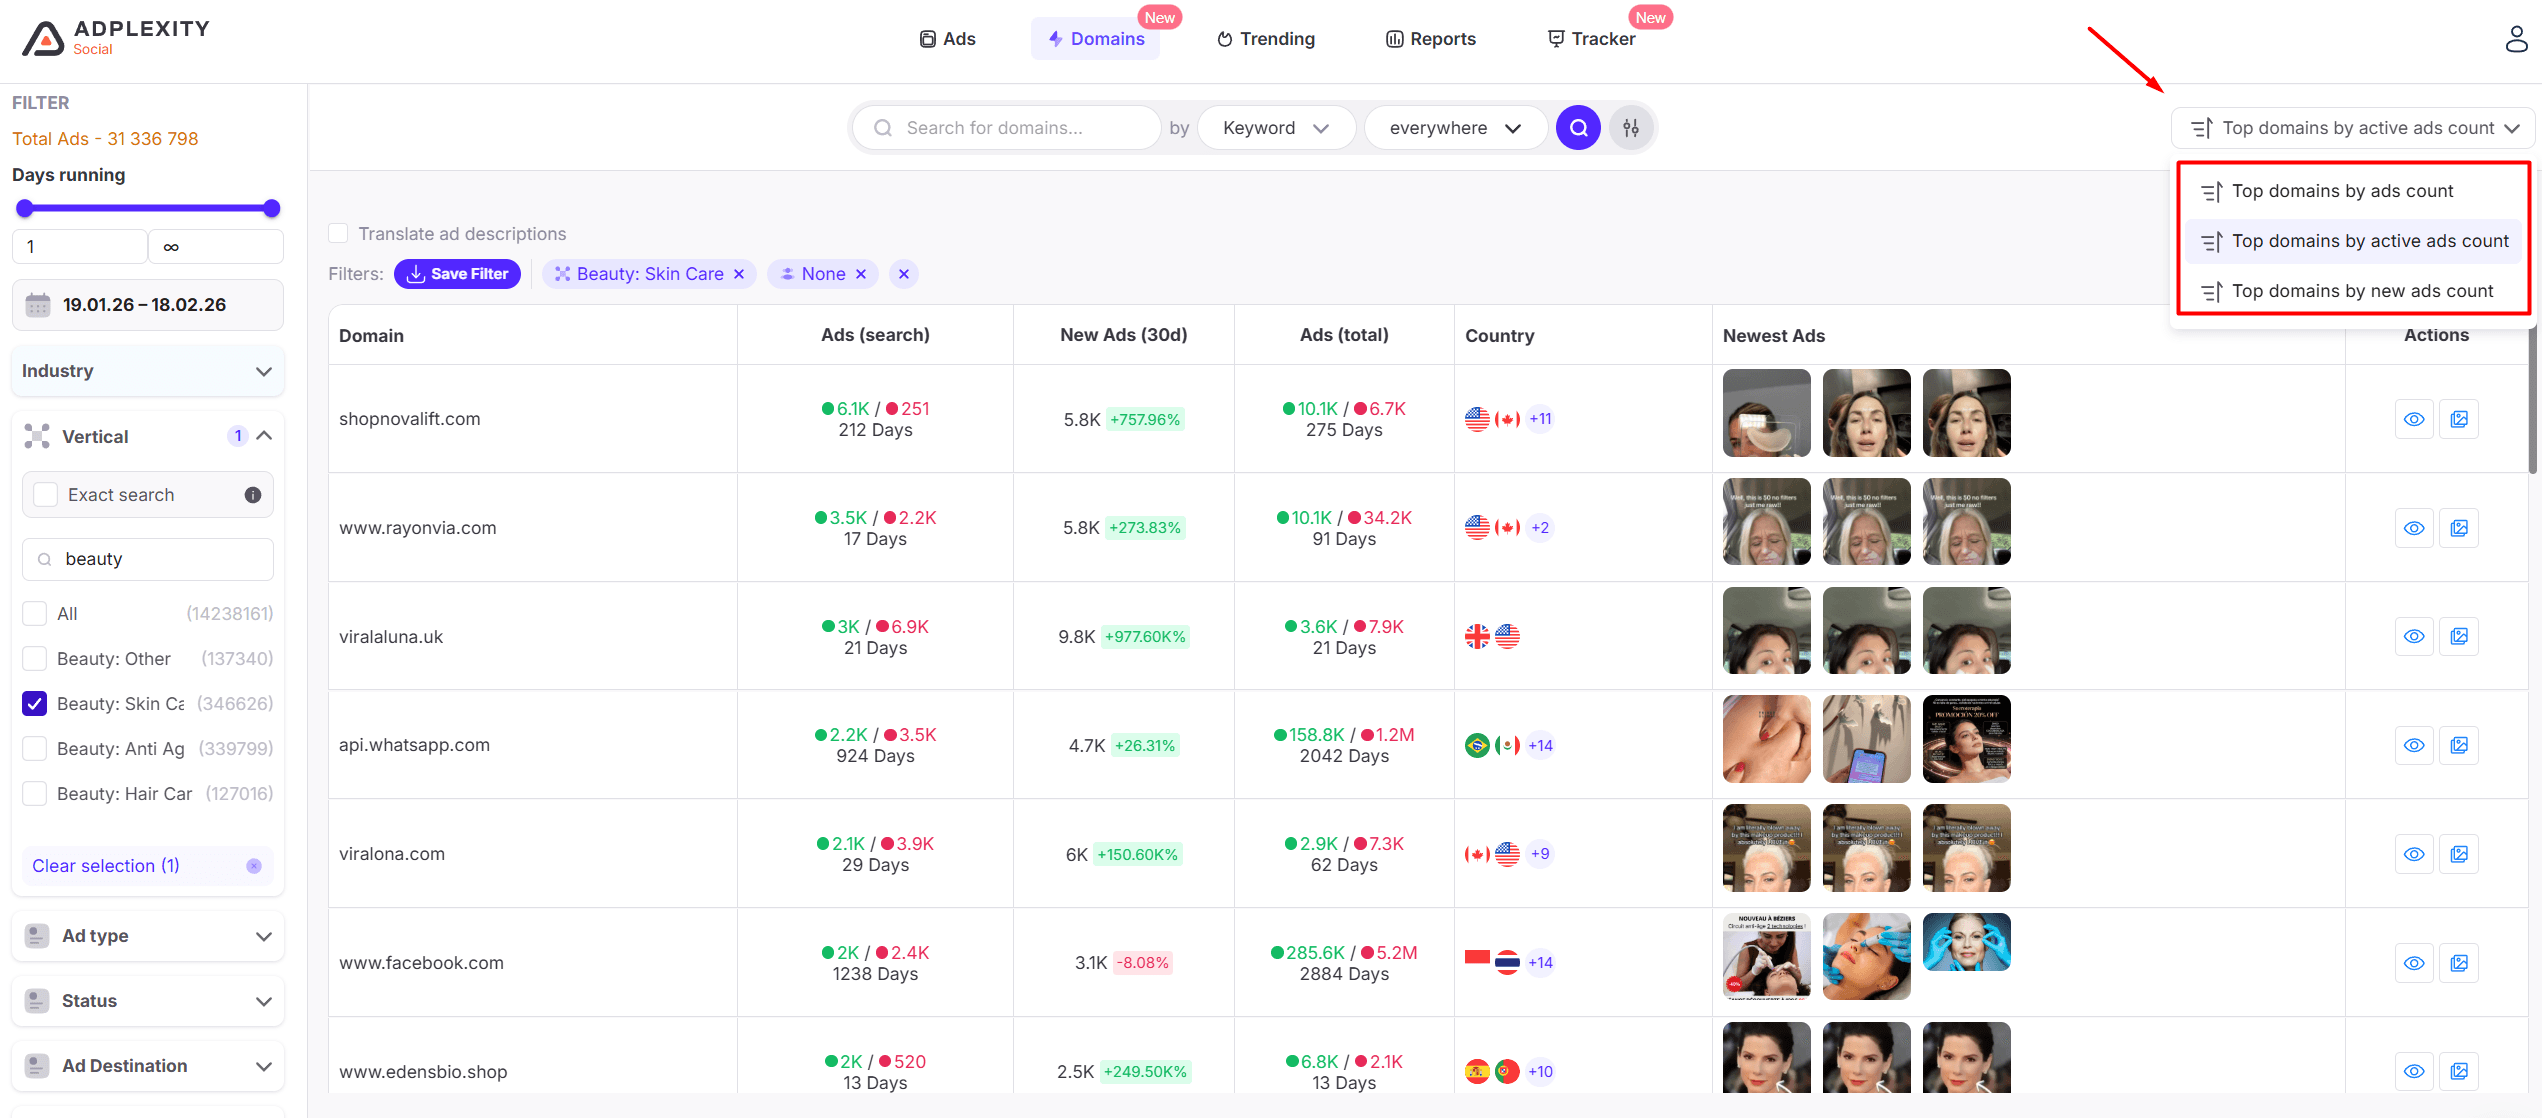
Viralaluna.uk: From Zero to 10,000 Ads in 30 Days
This one was striking. Viralaluna.uk went from essentially zero ads to almost 10,000 in a single 30-day window.
Their chart was the opposite of Revibezen's — a steep upward ramp with 3,000 ads active at the time of checking.
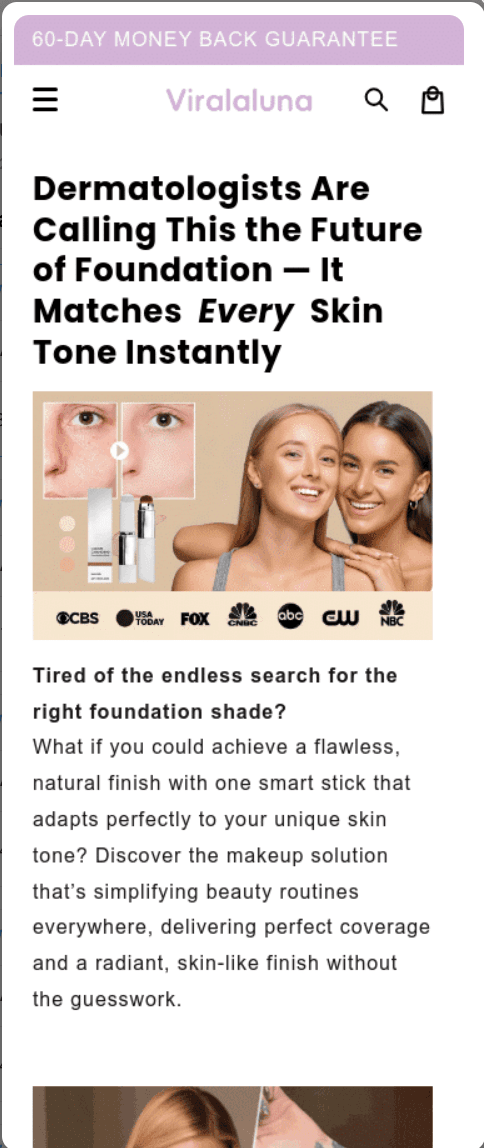
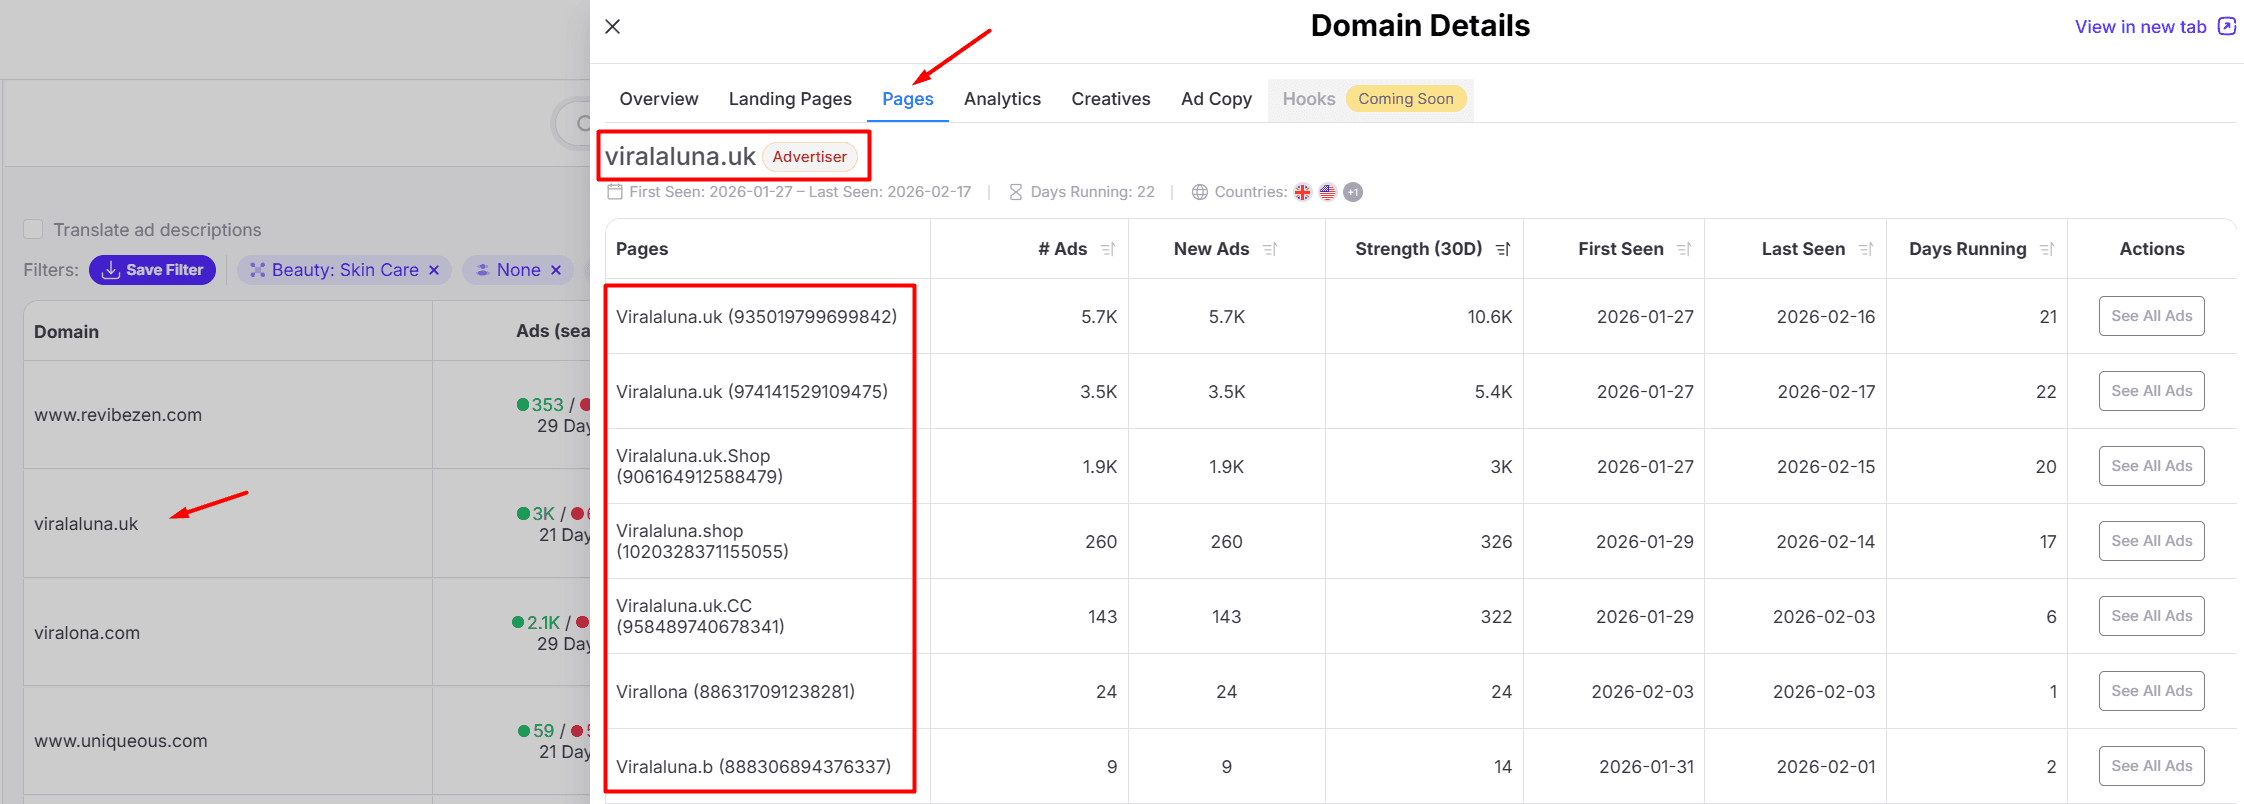
Their winning product was a game-matching foundation, with one landing page pulling 8,600 of those total ads.
The next closest product page had around 700 ads, so the concentration was extreme. When a brand puts that much of their budget behind a single product URL, it tells you they found something that's working, and they're pushing hard.
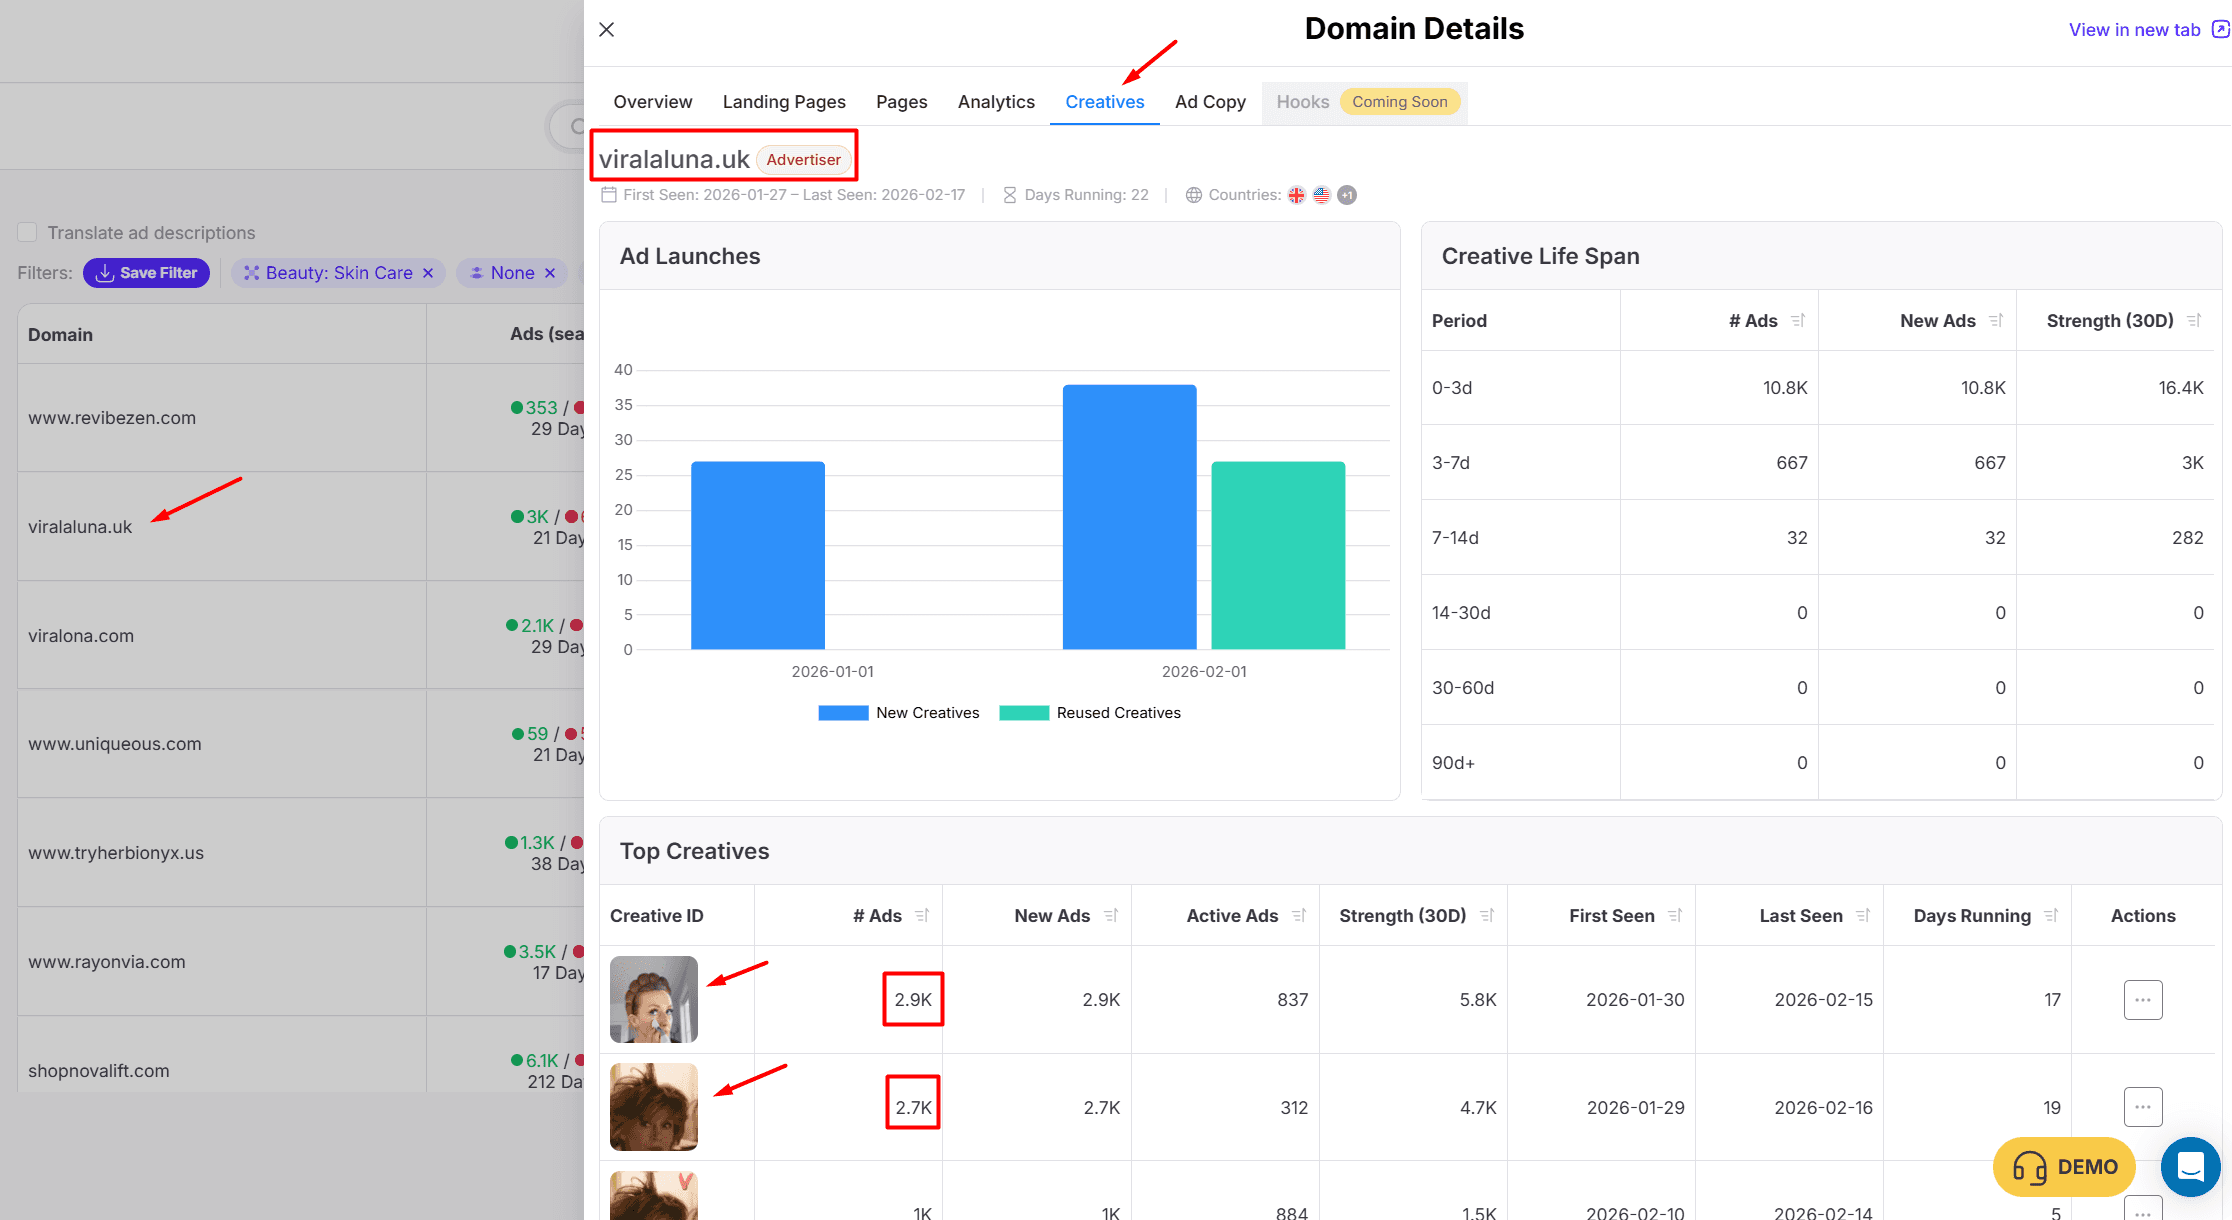
Their creative approach mixed UGC and celebrity content. One top creative — used in 2,900 ads with 837 still active — was pure UGC, no captions, just someone talking to the camera.
The second biggest creative was a one-minute mashup with famous faces and multiple UGC clips edited together.
Both linked to what appeared to be an advertorial-style landing page rather than a straight product page.
Unlike Revibezen's disposable fan page strategy, Viraluna ran from branded pages. Different approach, clearly still working given the scale.
ShopNovaLift: The One That's Printing Money
If you sort by active ads instead of total ads, ShopNovaLift jumps near the top.
Almost 10,000 active ads, representing 58% of their total — and the trend chart was going straight up.
When you see a brand where more than half their total ads are still live and the active count is climbing, that's about as strong a scaling signal as you'll find.
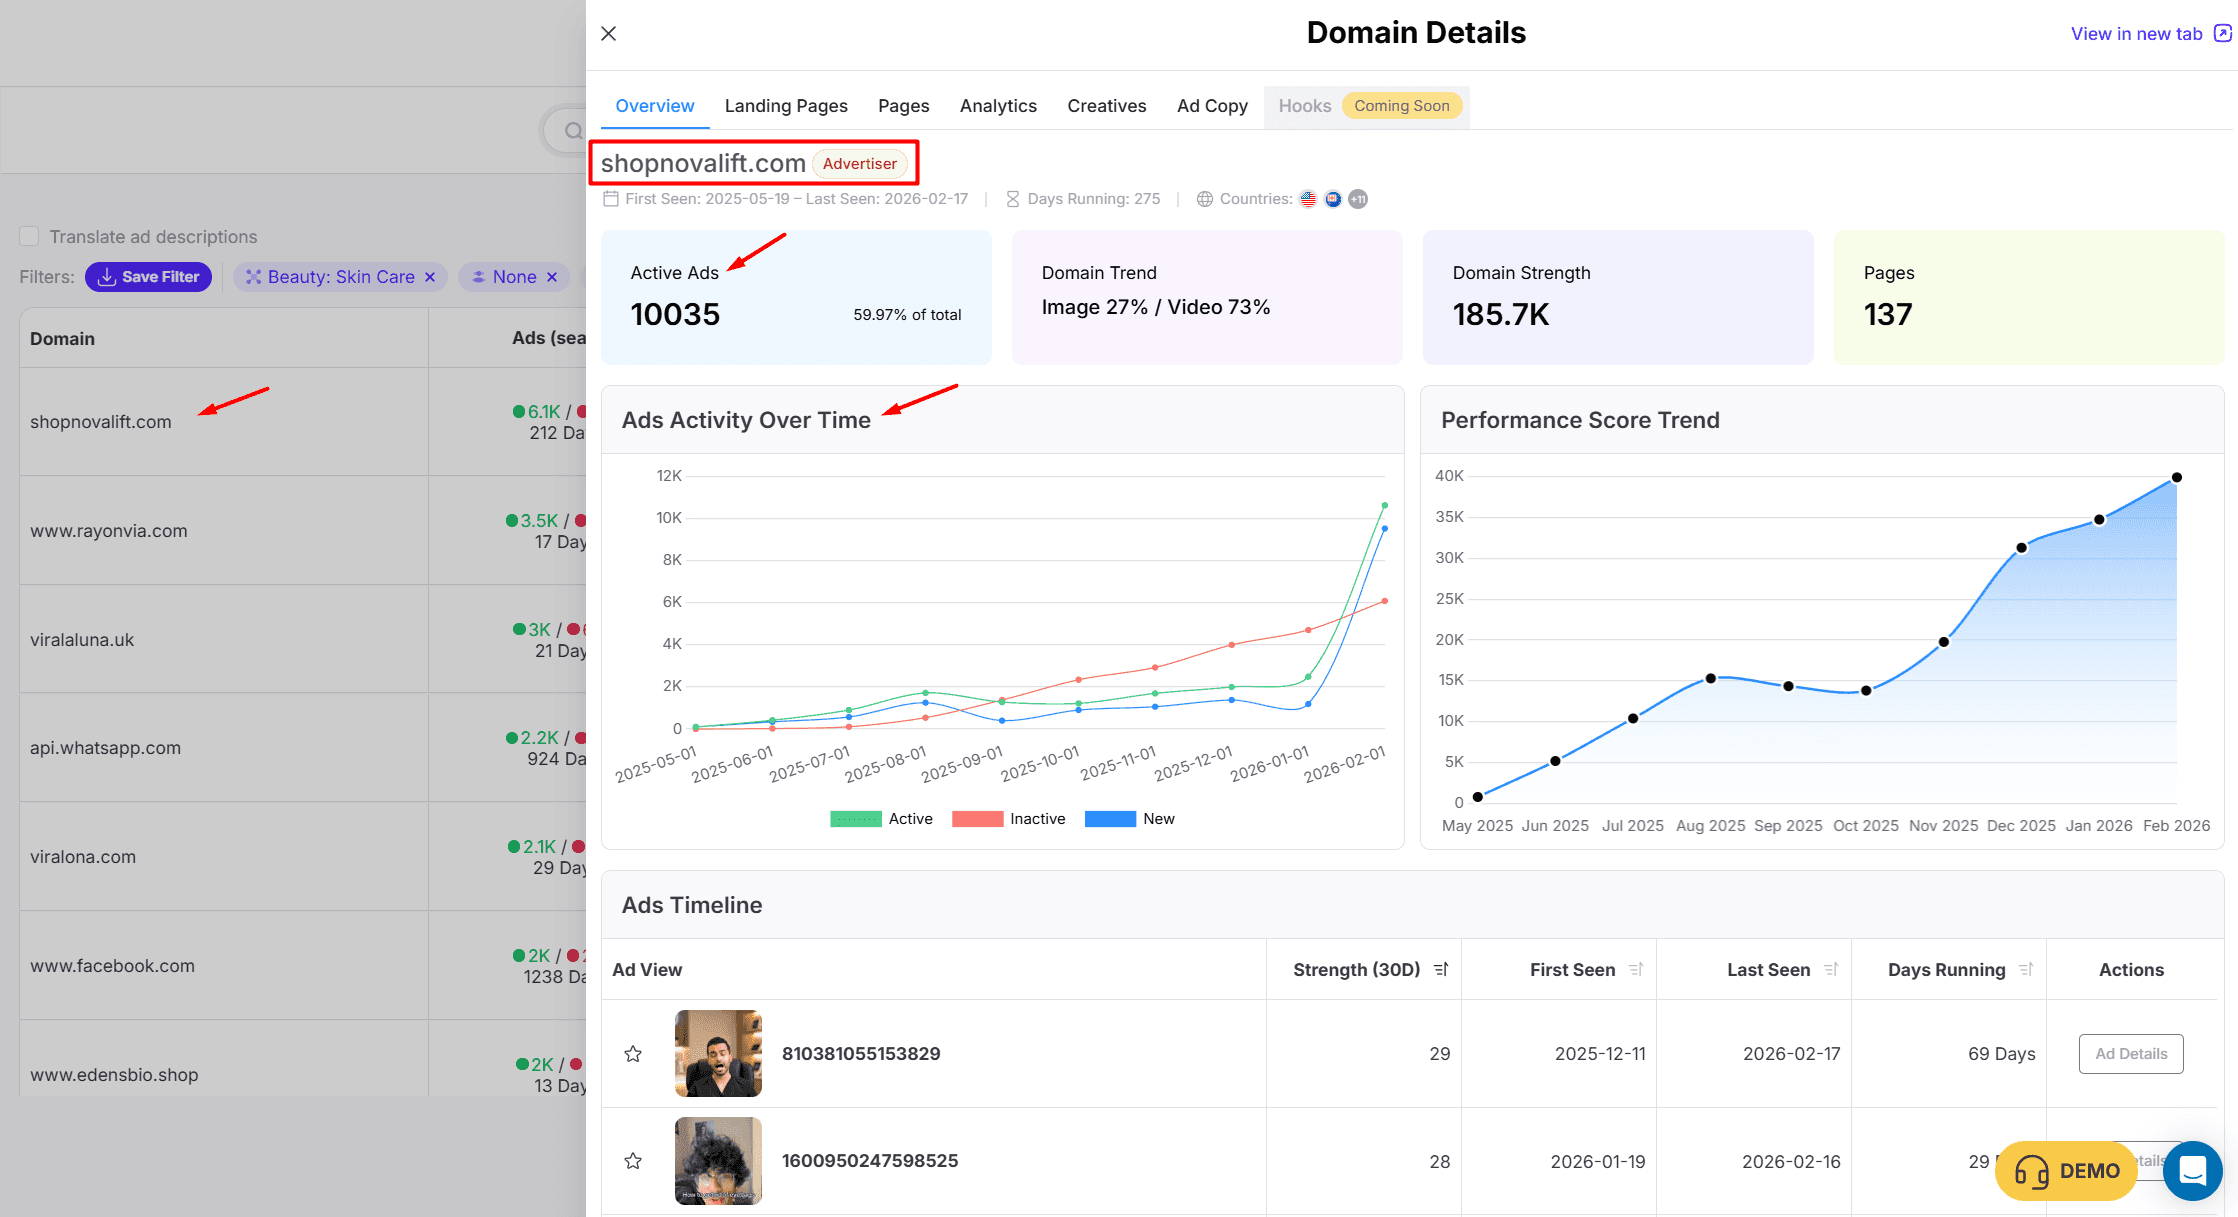
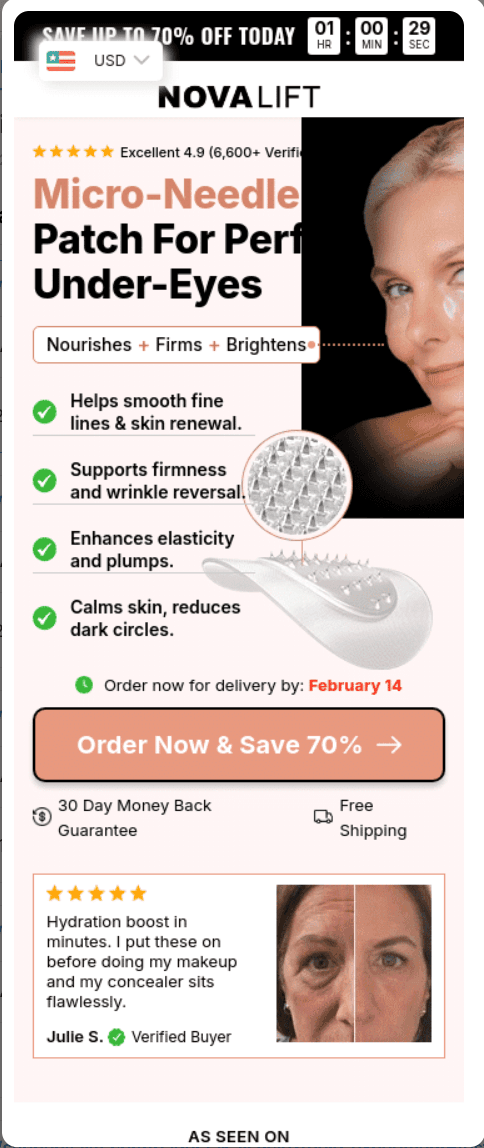
Their top product was a microneedle patch for under-eye treatment — not a cream, not an oil, but a physical product targeting a very specific concern.
Their landing page strategy mixed product pages and advertorials, testing different funnel approaches for what appeared to be the same core offer.
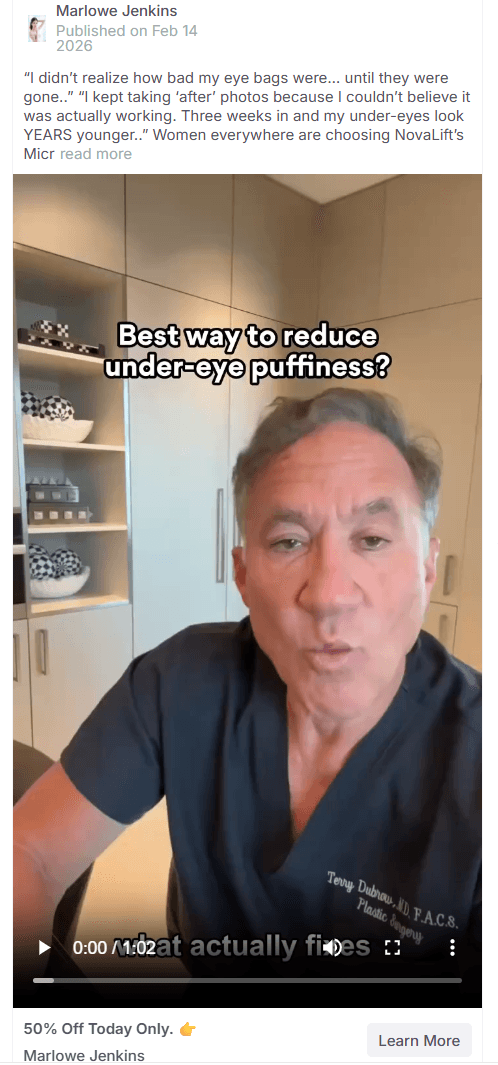
The creative that caught my attention had 3,200 active ads. It featured a doctor talking directly to the camera, with captions, explaining why the microneedle patch works.
This is the authority-figure creative format, and it's clearly performing well in this space. The video was educational, detailed, and positioned the product through a professional lens rather than a peer recommendation.
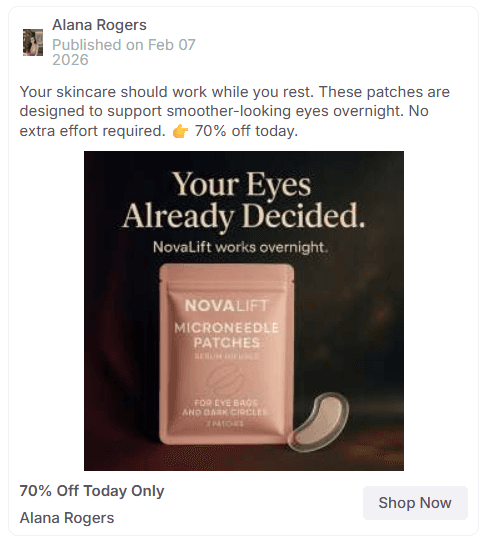
Their second-biggest creative was a static image with around 1,600 active ads.
Based on the positioning, it looked like a mid-funnel retargeting asset — something they'd show to people who'd already engaged with the video but hadn't purchased yet.
That kind of funnel thinking is exactly what separates serious operators from people just throwing ads at a wall.
And just like Revibezen, they were using personal-looking fan pages rather than branded ones to distribute their ads.
The strategy of making ads feel like they're coming from regular people rather than a brand keeps showing up across the top players
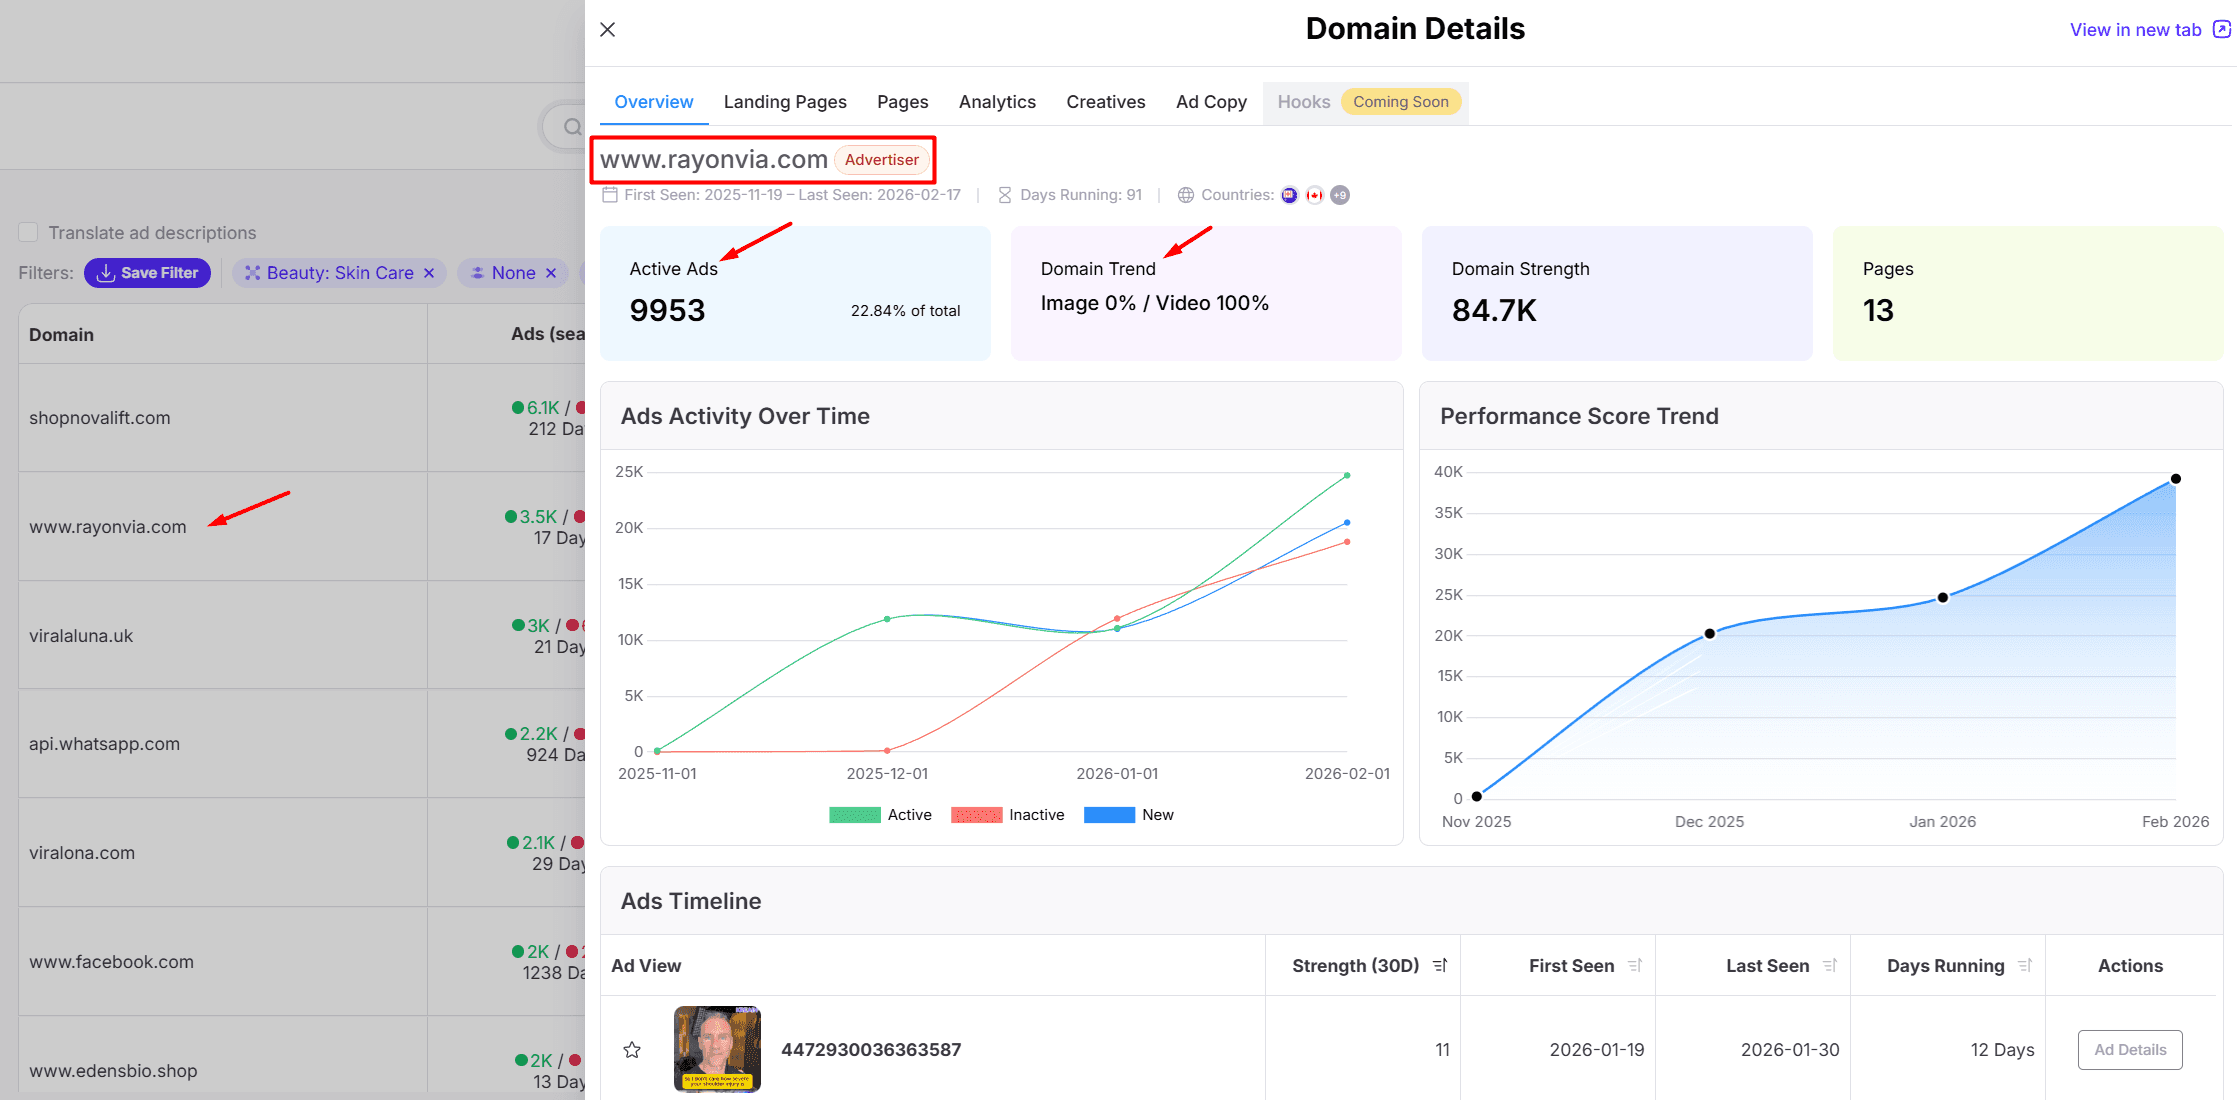
Rayonvia: When "Skincare" Crosses Into Other Niches
Rayonvia had 9,500 active ads and was 100% video — not a single static image in their mix.
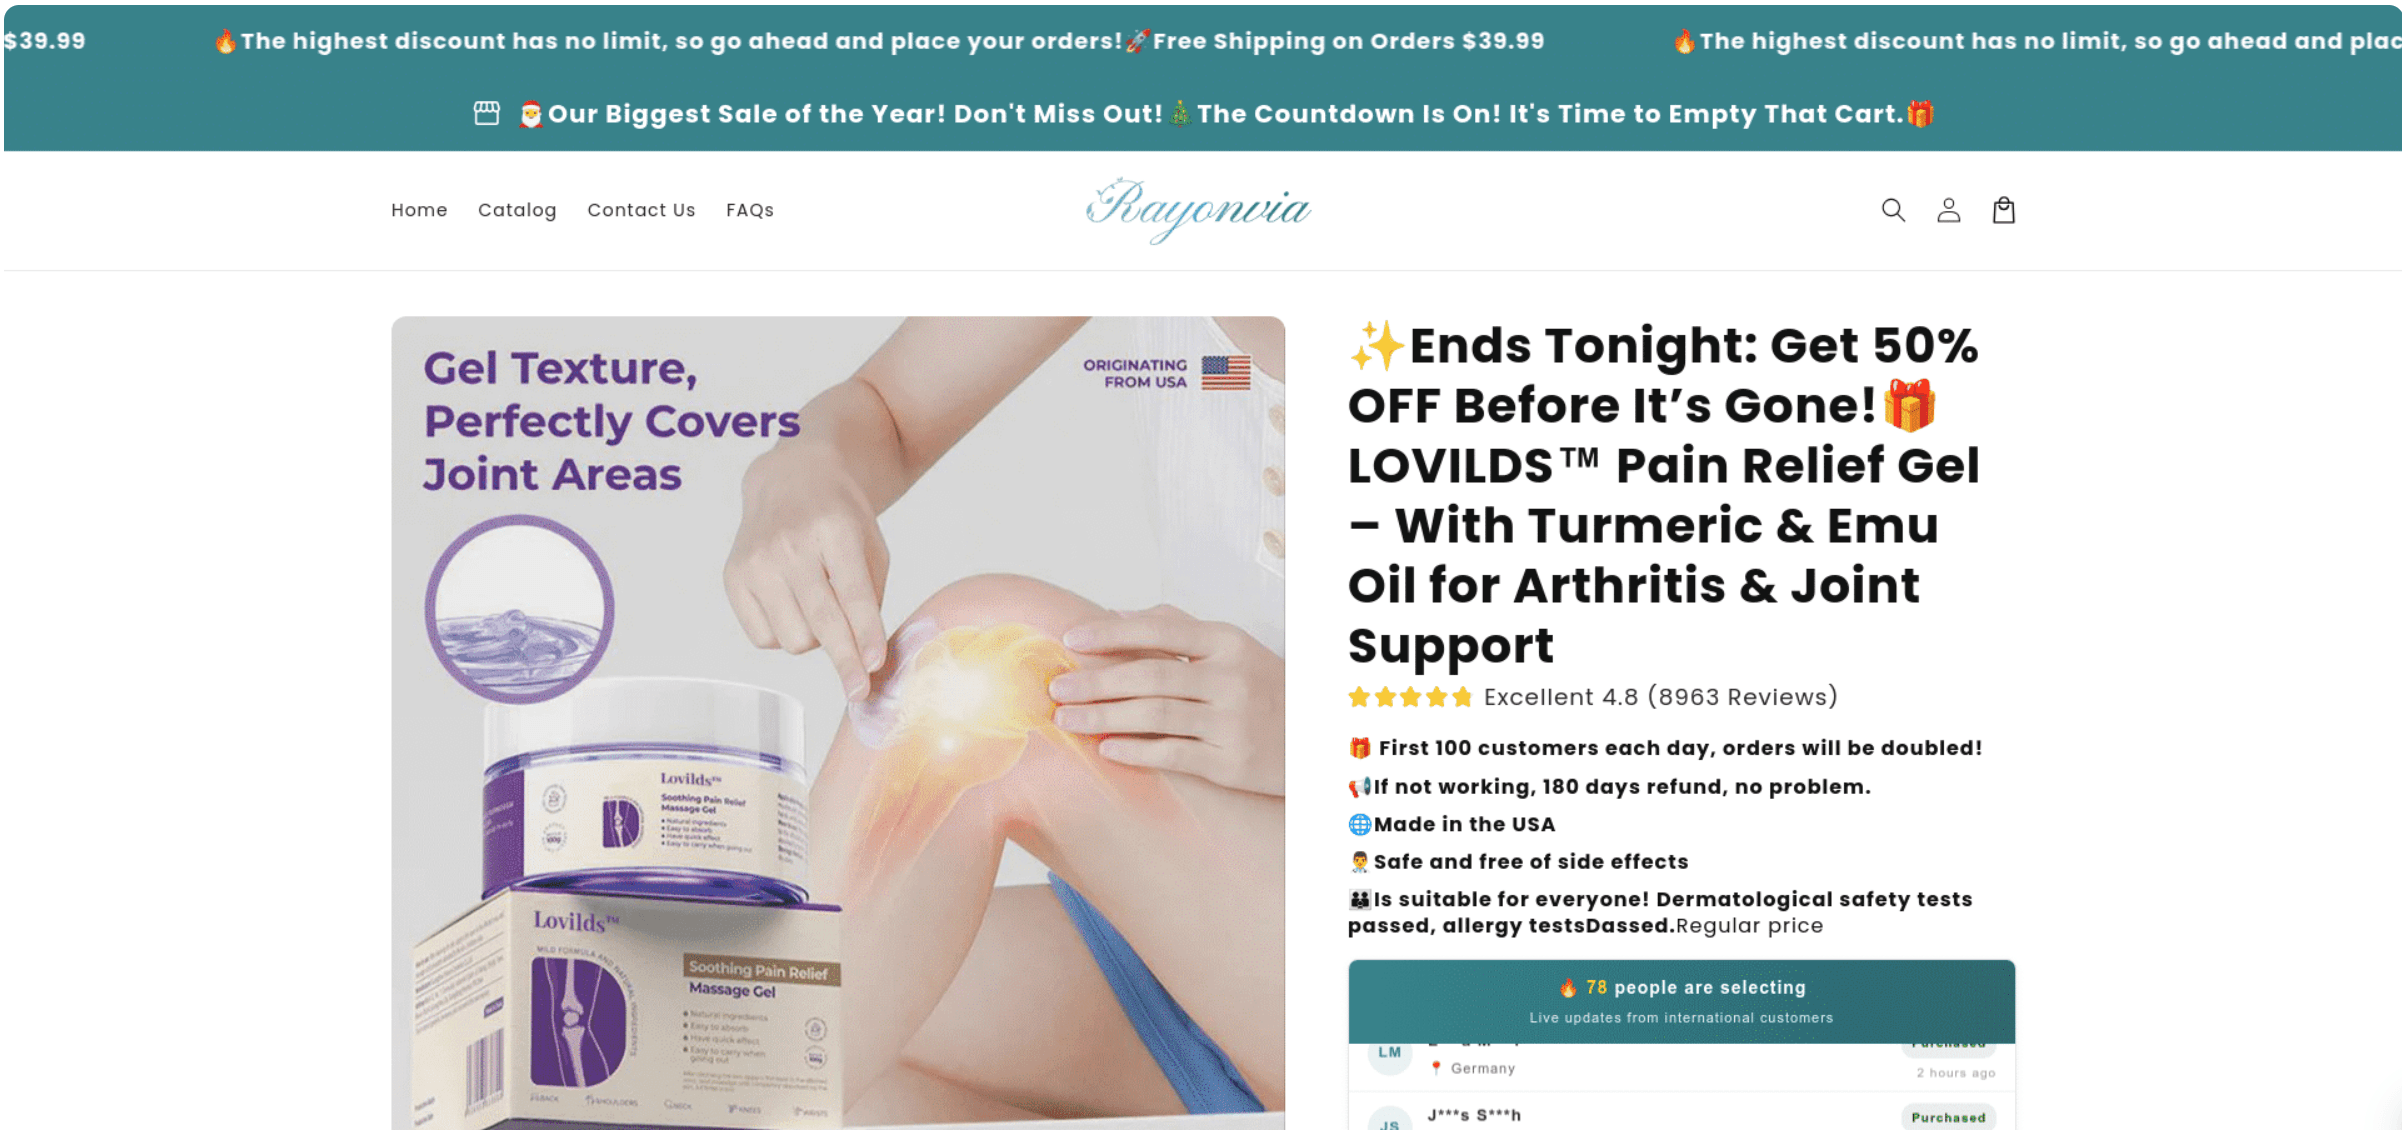
But when I dug into their landing pages, the top products were actually pain relief balms and joint support gels with turmeric.
This brand’s main focus is on the pain vertical, and secondly, they were pushing a skincare product as well.
This is proof that some brands are pushing different categories and scaling those in which they find success.
Creative Patterns: What the Winners Have in Common
After looking at dozens of the top domains and their creatives, a few patterns kept repeating.
Long-form video is king.
The most successful creatives in skincare aren't 15-second clips. They're running 1 to 6 minutes, sometimes longer.
That's counterintuitive for people used to thinking in terms of short attention spans, but it makes sense for this category.
Skincare is a considered purchase — people want to understand what the product does, see proof, and hear an explanation before they buy. Longer videos give you room to do all of that.
UGC and AI-generated UGC are everywhere.
Almost every top creative had some form of user-generated content — someone talking to the camera, showing the product, demonstrating results. What's new is how many of these are potentially AI-generated. The quality has reached a point where distinguishing between a real person and an AI avatar is genuinely difficult. Whether that's a sustainable approach is debatable, but right now it's being used at a massive scale.
The doctor/authority format converts.
Multiple top brands — ShopNovaLift being the clearest example — are running creatives where a medical professional or authority figure explains the product.
This works especially well for products making functional claims (anti-aging, eye lifting, pain relief) where credibility matters more than aesthetics.
Product pages and advertorials coexist.
There's no single "right" funnel. Some of the top brands send traffic directly to Shopify product pages. Others use advertorial-style landing pages that educate before selling.
Several use both, likely split-testing or using different approaches for different audience segments and funnel stages.
Multiple fan pages for organic appearance.
The biggest spenders aren't running all their ads from a single branded Facebook page. They're distributing across many pages — often with personal names rather than brand names — to make the ads feel less commercial in the feed.
It's a well-known tactic in performance marketing, but it's being executed at a serious scale in skincare right now.
How to Run This Analysis Yourself
The process I walked through above is straightforward once you know which filters and sorting options to use. Here's the quick version.
Start with AdPlexity Social's Vertical filter — select Beauty: Skincare (or Beauty: Anti-Aging if you want to narrow down).
Set your timeframe to 30 days for a current snapshot. From there, the domain dimension is your best friend. Sort by new ads count to see who's launching the most aggressively right now. Sort by active ads count to see who has the most live campaigns.
The difference between these two views matters — a brand launching a lot of new ads while also maintaining high active counts is in full scaling mode.
A brand with a high total but declining actives is pulling back.
When you find a domain worth studying, dig into their landing pages to understand their product lineup and funnel strategy.
Check their fan page distribution to see if they're running from branded or personal-style pages. And look at their creative data — specifically, which creatives have the most active ads, not just the highest totals. A creative with 9,000 total ads but zero active ones already burned out.
A creative with 2,500 active ads out of 3,000 total is on fire right now.
You can also narrow your analysis by country if you're targeting a specific geo, or use the tech stack filters to focus on Shopify stores specifically, if you're looking for ecom competitors.
The Bottom Line
Skincare on Meta is a 350,000-ad-per-month vertical dominated by DTC ecommerce brands running long-form video creatives at scale.
The winning strategies lean heavily on UGC (real or AI-generated), authority-figure content, multi-page distribution for organic feel, and split-testing between product pages and advertorials.
The brands that are scaling right now aren't the ones with the prettiest ads. They're the ones with the smartest distribution, the most disciplined creative testing, and the data to tell them what's actually working.
If you're competing in this space — or thinking about entering it — the intelligence is there. You just have to know where to look.
🚀 If you’re serious about: uncovering the strongest campaigns,
tracking real, revenue-driving funnels, and dissecting the exact angles top marketers are using right now…
Then AdPlexity Social is hands-down the #1 tool you should be using
Discover Winning Meta Ads
Similar Blogs