
How to Find Winning Search Arbitrage Keywords on Meta Right Now
Share:
Key Takeaways
The search arbitrage space is more competitive than ever, but operators who are still profitable are leaving clear signals in the data. AdPlexity Social's Domain analytics and Arbitrage Keywords views let you see exactly which keywords are growing in ad volume right now, which creatives are being deployed most aggressively, and how recently those campaigns launched. You don't need to guess. The data tells you where the money is moving.
If you run search arbitrage on Meta, you already know the last 12 months have been brutal. RPMs have compressed. Traffic quality filters are stricter. The operators who used to print money on autopilot are now grinding for margins they can barely defend. And if you are just getting started, you are walking into a space where the low-hanging fruit has already been picked.
But here's the thing: some people are still making it work. The proof is sitting right in the ad data.
When a search arb operator is scaling a keyword, they do not do it quietly. They deploy ads in volume. Tens of ads, sometimes hundreds, pointing at the same landing page, the same feed, the same keyword phrase. And when that volume is growing week over week, it is about as close to a profitability signal as you can get without seeing their revenue dashboard.
This post walks you through exactly how to read those signals using AdPlexity Social, from identifying which feed domains are the most active right now to drilling into specific keywords that are growing fastest, to finding fresh creatives you can use as a starting point for your own tests.
Whether you are a seasoned operator trying to find your next scalable angle, or someone just getting started and trying to avoid burning budget on dead keywords, this workflow gives you a research foundation that most people in the space are not using.
Watch the video:
Why Ad Volume Is the Closest Proxy You Have to Profitability
Search arbitrage research comes with a fundamental problem: you cannot see anyone's revenue numbers. Cost per click, RPM, net margin — none of that is visible from the outside. What you can see is behavior.
When an operator finds a keyword that converts, they scale it. They launch more ads, test more creatives, and push more traffic to the same feed. That behavior shows up as ad volume. And when you can see that ad volume growing from one period to the next, you are watching someone double down on something that is working.
That is the core logic behind this entire workflow. You are not reverse-engineering profitability directly. You are finding the footprint that profitable campaigns leave behind.
AdPlexity Social indexes Meta ads at a rate of 15 million new ads per month, with over 100 million ads in the database. In the search arbitrage vertical, that coverage is dense enough that you can identify which feed domains are seeing the most activity, which keyword phrases are attracting the most new ad spend, and which creatives are being used across the most active campaigns, all without any guesswork.
Step 1: Start With the Domain Dimension to Find the Most Active Feeds
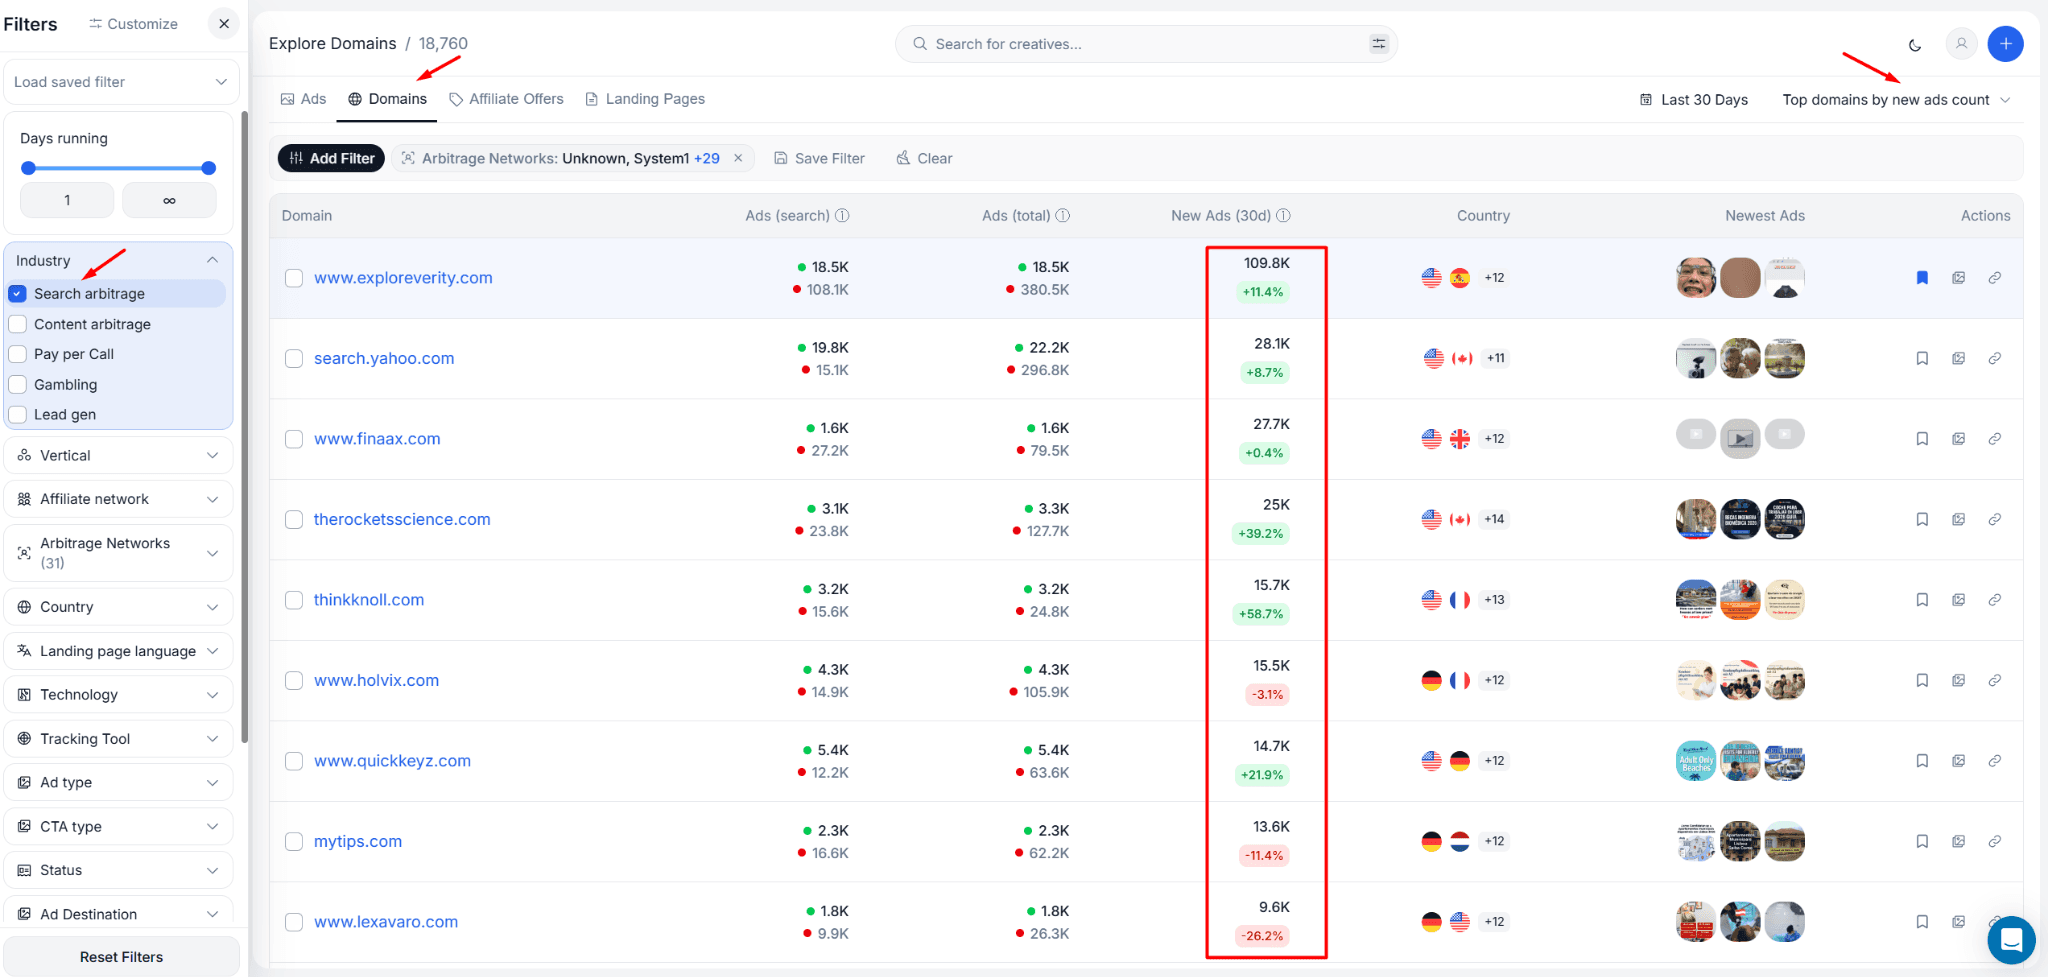
The first thing you want to do is not browse ads. Most people open a spy tool and start scrolling through individual creatives, which gives you a surface-level view with no context. Instead, go straight to the Domains tab inside AdPlexity Social.
Filter by the Search Arbitrage industry. This narrows the domain list down to advertisers whose landing pages and redirect chains are identified as search feed traffic. What you get is a ranked list of domains by ad activity, showing you which feed domains have the highest volume of ads pointing at them right now.
At the time of this research, Visymo was the clear leader in terms of 30-day ad volume with 257,000 ads deployed in that window. The Unknown category, meaning domains that AdPlexity identifies as search arb but cannot attribute to a named feed, came in at 161,000. Tonic sat around 80,000.
The gap between Visymo and Tonic is significant. When one feed domain is attracting more than three times the ad volume of another, that tells you something meaningful about where operators are finding better monetization right now.
From the domain list, pick the highest-activity domain and click through to its detail view. This is where the real research starts.
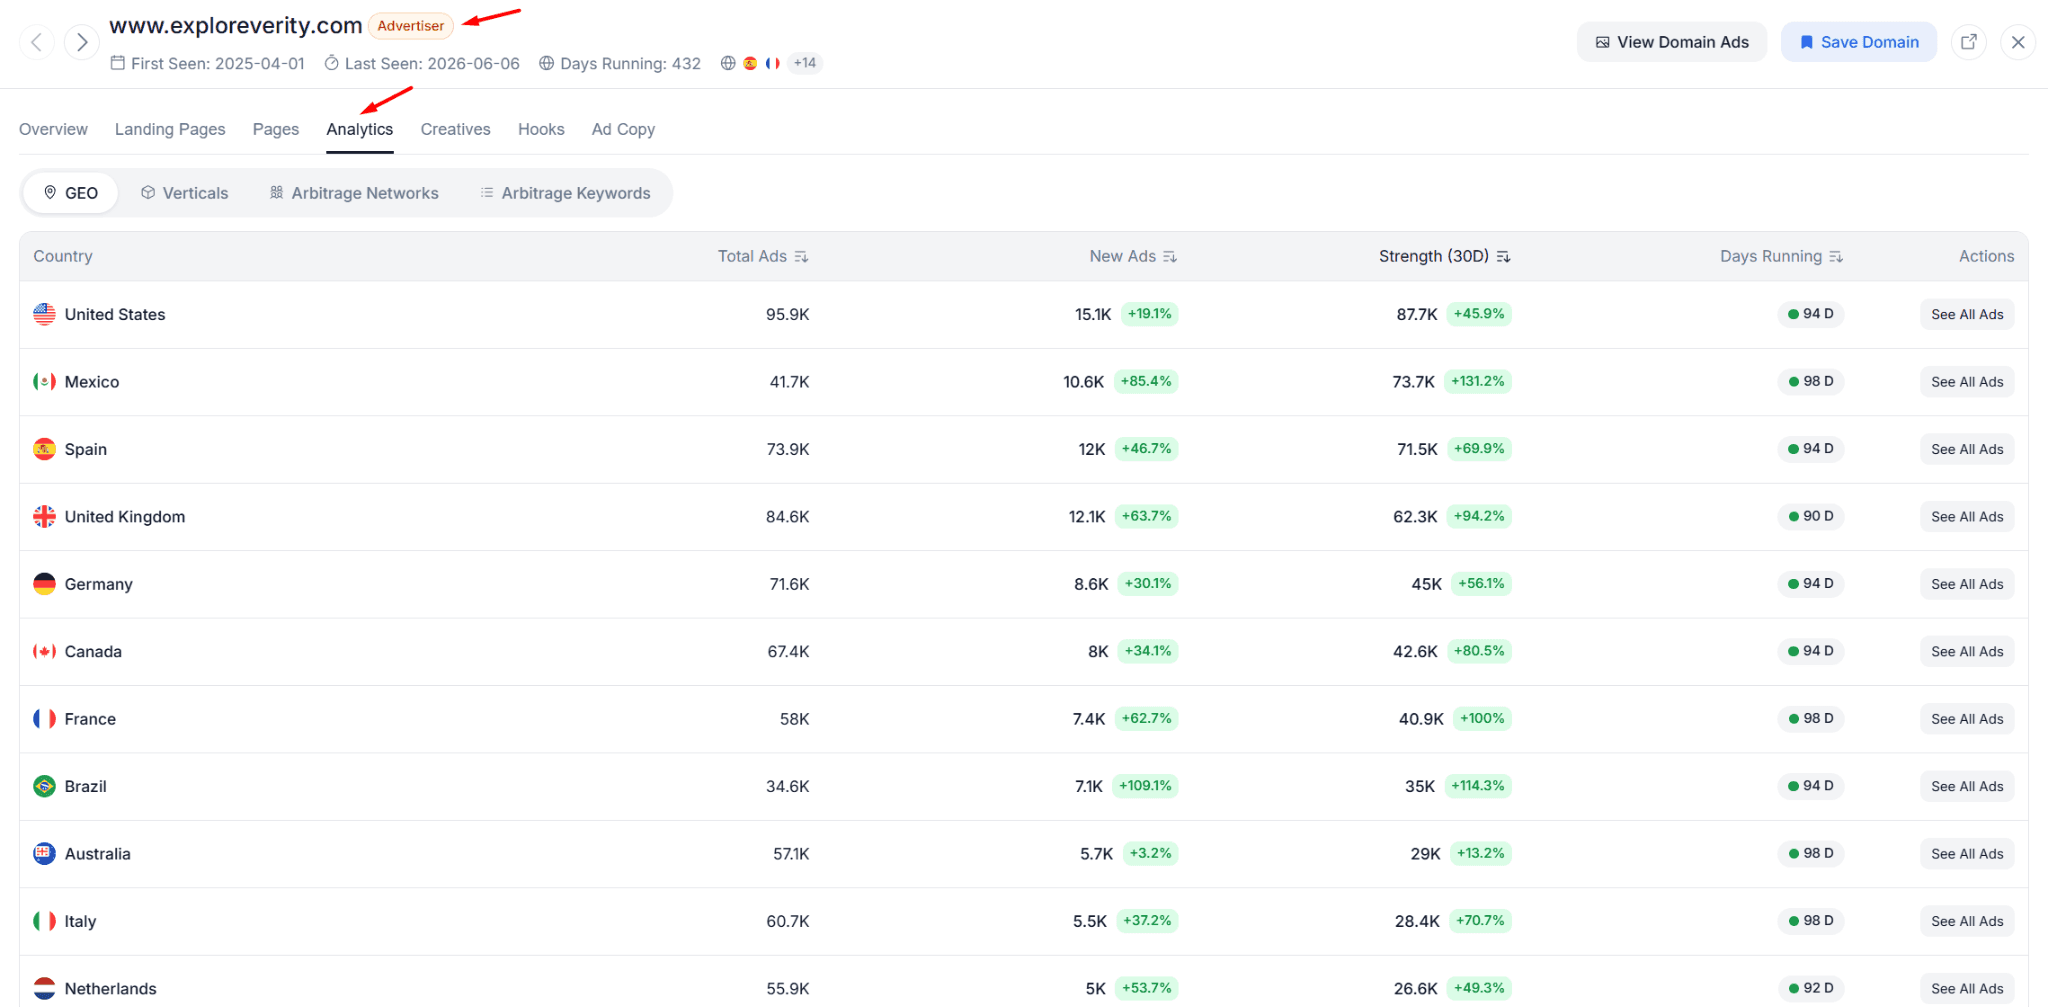
Step 2: Navigate to Arbitrage Keywords and Sort by Growth
Inside the domain detail view, you have several analytics options. Skip the Verticals breakdown for now. It gives you a high-level category split, but it does not tell you what you actually need to know at this stage.
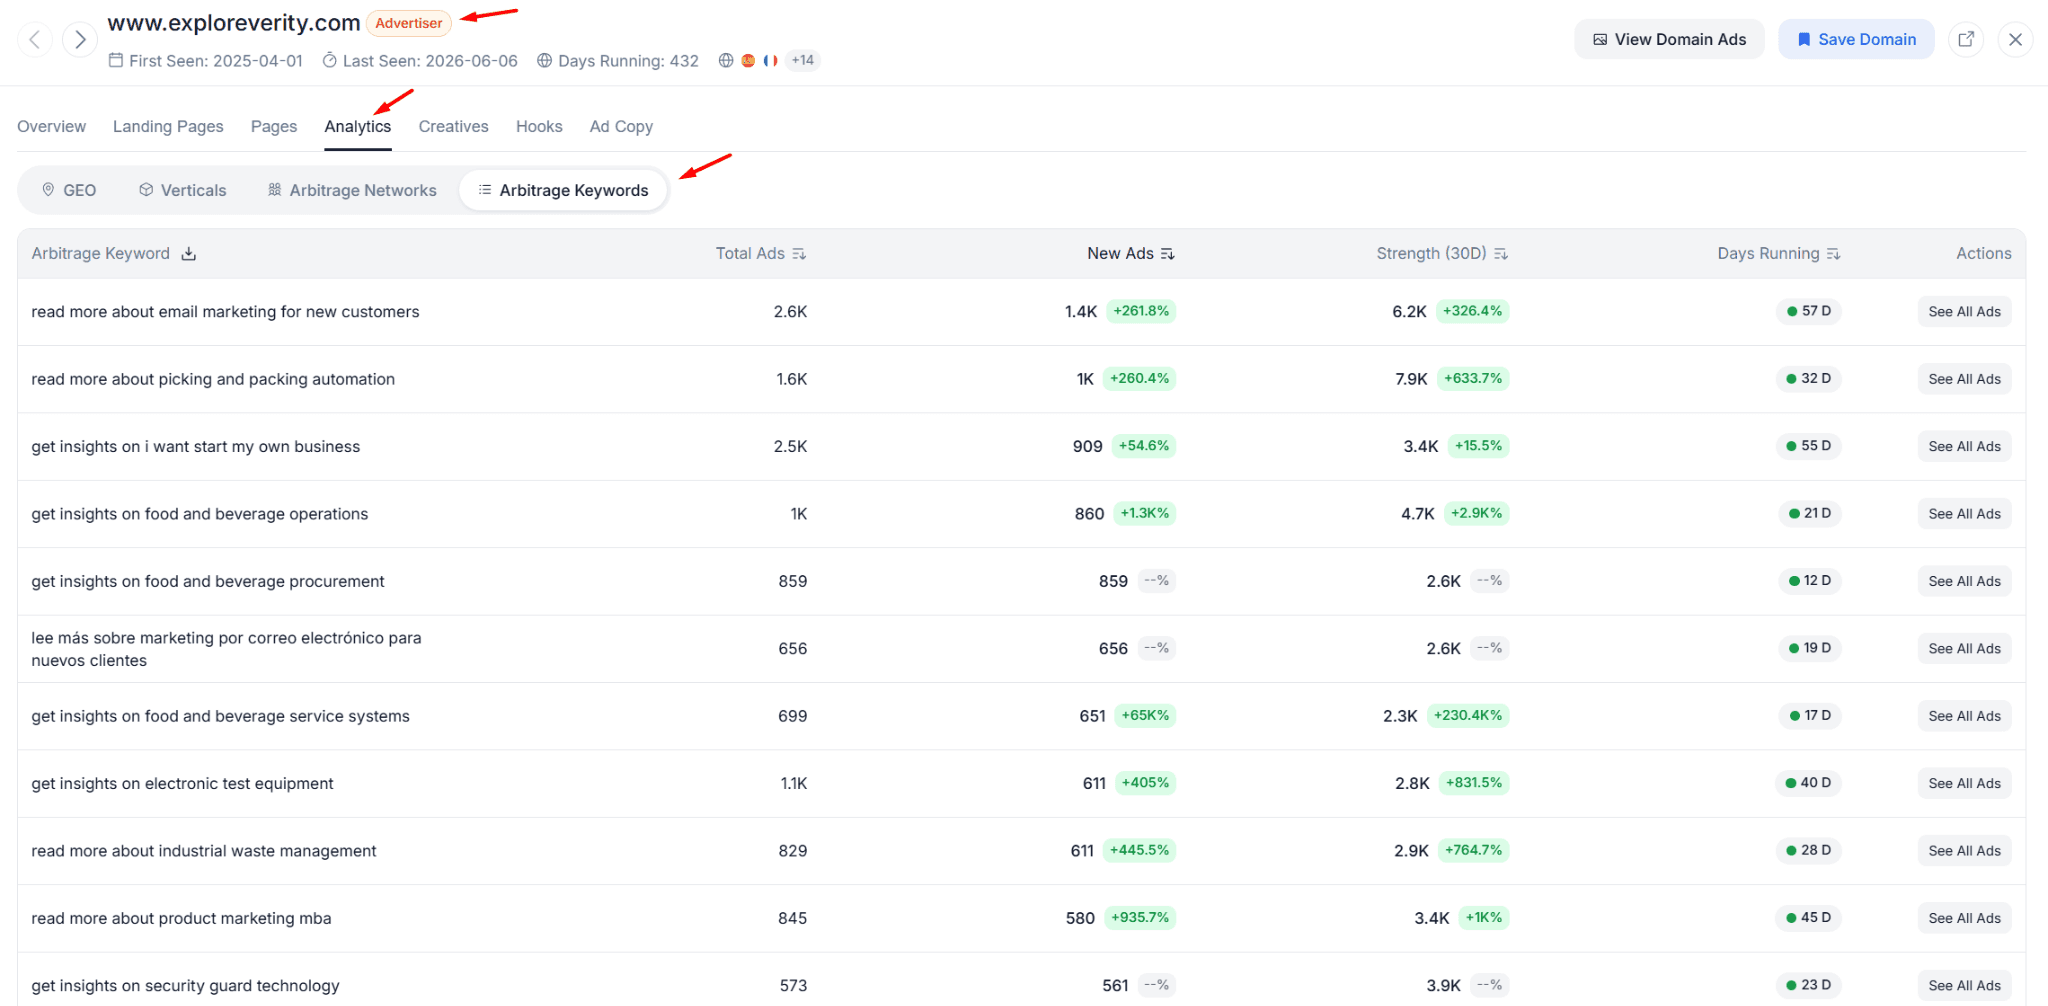
Go directly to the Arbitrage Keywords tab.
This is where AdPlexity Social surfaces the specific keyword phrases being used in ads pointing to this domain. Each keyword comes with data on total ads, new ads in the last 30 days, active ads at the moment of your search, and a comparison against the previous 30-day period.
You have two main sorting options. You can sort by the Strength score, which is an algorithm that combines total ad count, new ad volume, and how long those ads have been running. Or you can sort by new ads in the last 30 days, which gives you a raw momentum signal: where is fresh spend being deployed right now?
For a first pass, sort by new ads. This surfaces the keywords that are actively being scaled at this moment, not necessarily the ones with the most historical volume.
Step 3: Read the Signals — Growing vs. Declining Keywords
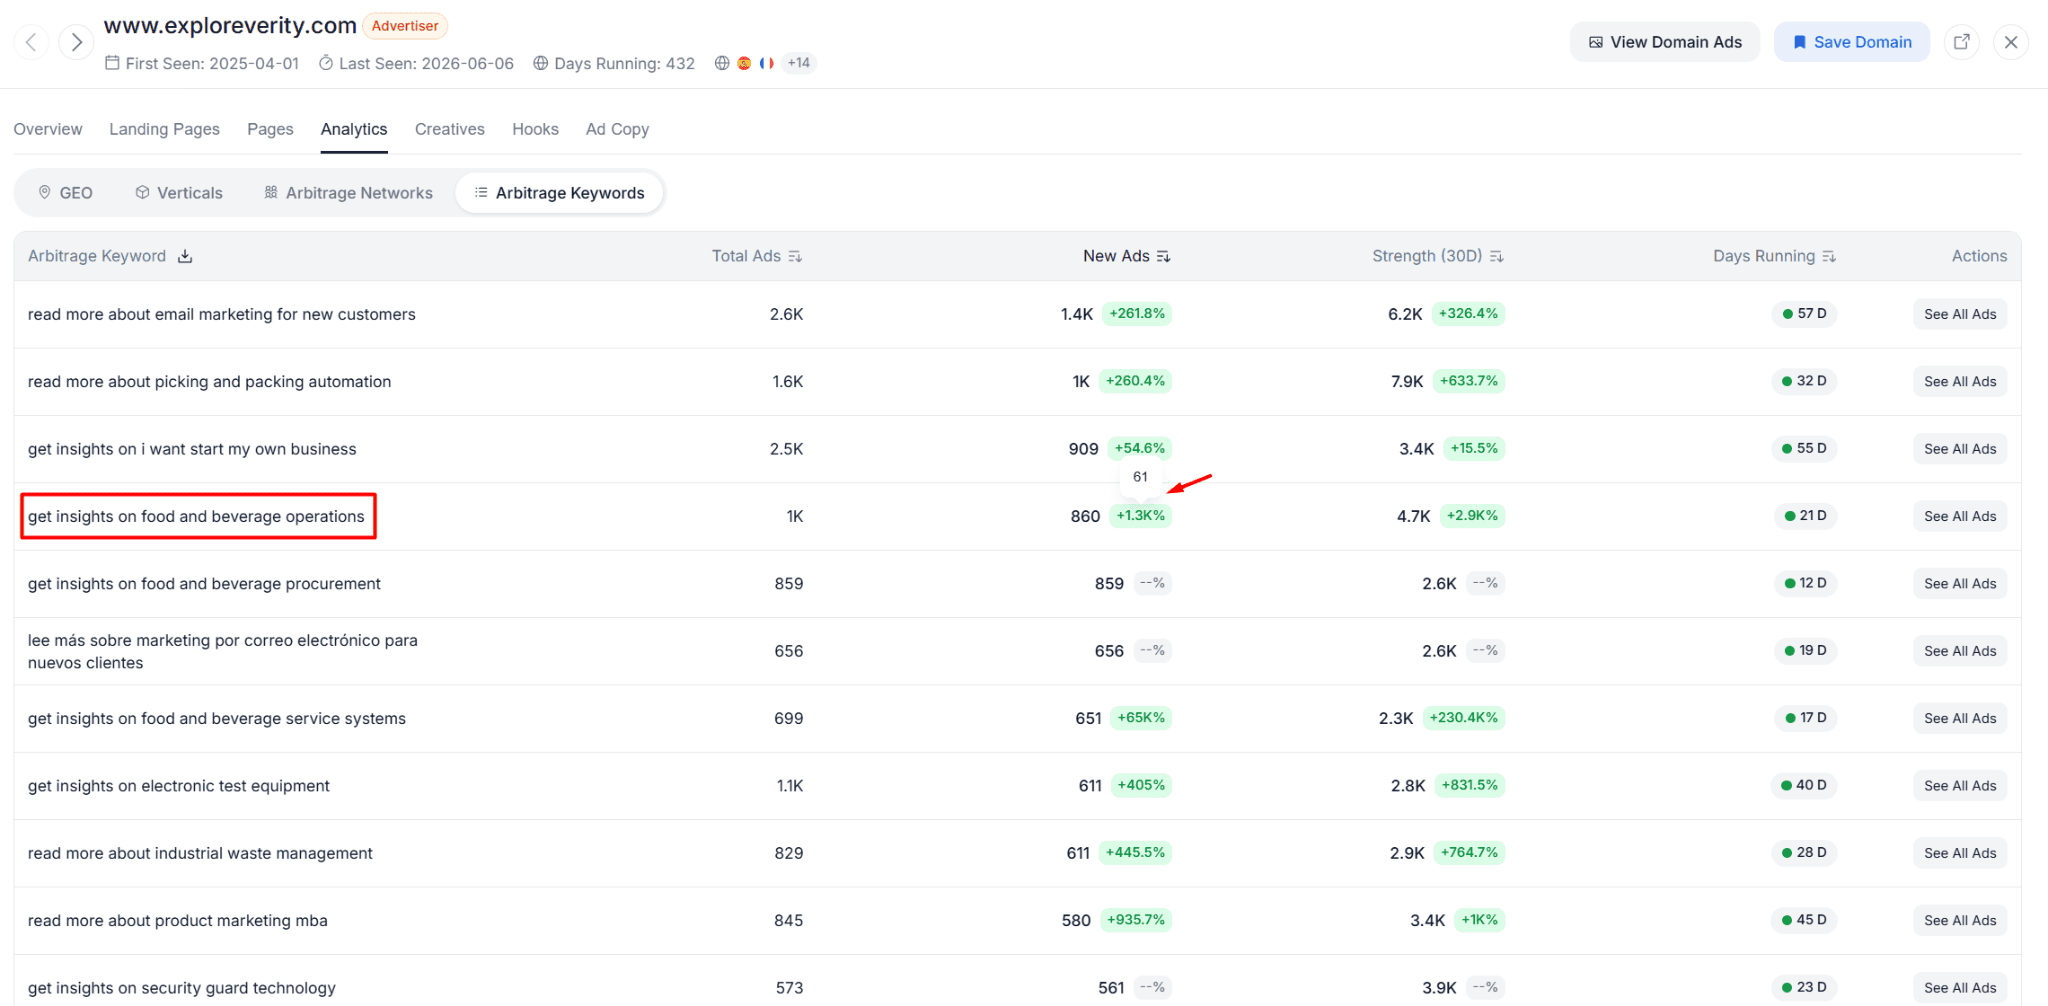
Once you have the keyword list sorted by new ad volume, the period-over-period comparison column is the most important thing on the screen.
A positive number means the ad volume on that keyword grew from the previous 30-day period to the current one. A negative number means it shrank. And when a keyword shows no comparison figure at all, it means there is no data from the previous period, which usually means the campaign is less than 30 days old.
Growing fast is the primary signal you are looking for. In the Visymo data, there were keywords that jumped from 31 ads in the previous period to 849 in the current one. That kind of growth does not happen by accident. Someone tested it, it worked, and they scaled.
The keywords showing declines are equally informative. If a keyword had 2,400 ads and is now shrinking, that usually means one of two things: either the competition crowded it out, or the monetization dropped and the operator pulled back. Either way, it is not where you want to start testing.
The zero-history keywords, the ones with no prior-period comparison because they launched in the last 30 days, are arguably the most interesting data points in the list. During this research, keywords like facial rejuvenation clinics went from 1 ad to 447 with no previous data. Keywords in food and beverage operations and B2B automation categories were showing similar explosive early growth.
That kind of signal, brand new with fast early momentum, is what you are hunting for.
Step 4: Cross-Reference Creatives to Find Fresh Angles
Knowing which keywords are growing is one half of the research. The other half is understanding how people are advertising against those keywords. That is where the Creatives view comes in.
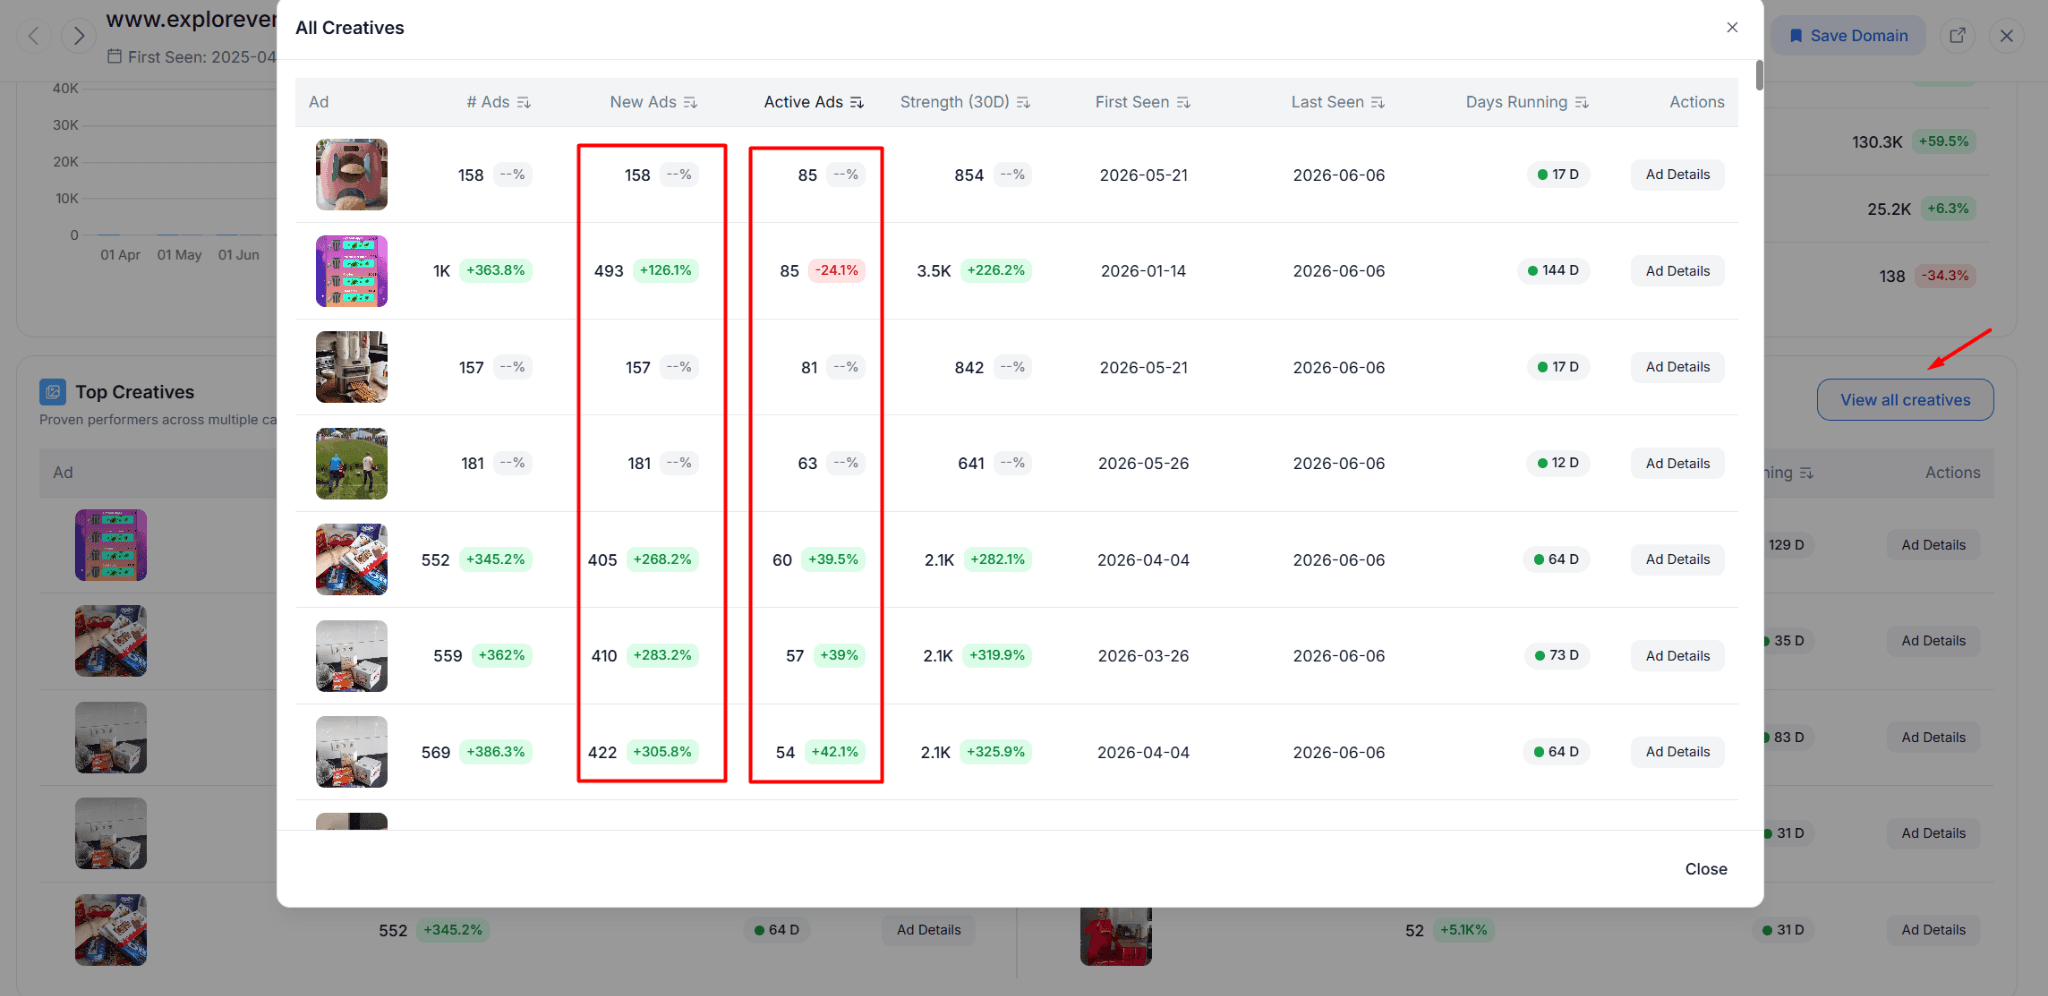
From the same domain detail view, navigate to Creatives and click View All Creatives. This surfaces the image and video creatives being deployed most aggressively across ads pointing to this domain, sorted by active ad count and new ad volume.
What you are looking for here is a combination of signals, not a single metric. You want creatives with a high number of active ads, a good number of new ads in the recent period, and a relatively short run time. That last point matters more than most people realize.
A creative running 141 days with 2,400 total ads has almost certainly been seen by a large chunk of the relevant audience already. The competitive density around it is high. Launching something similar now carries real risk that you are walking into a saturated angle.
But a creative running 9 or 14 days, showing up near the top of the active-ads ranking with no prior-period data? That is a different story entirely. During this walkthrough, there were several creatives in exactly that position, including one related to automation equipment and another tied to industrial electrical content, both under 14 days old and already sitting among the top performers by active ad count.
The practical move here is not to copy these creatives. It is to understand the category and angle they represent, then build your own version targeting the same keyword. If "automation equipment manufacturer" is generating active search arb traffic right now, you want a creative that fits that query intent, not the exact image someone else is running.
Step 5: Export the Data and Let AI Do the Heavy Lifting
One of the more underused features in this workflow is the ability to download the Arbitrage Keywords table as a CSV. You can do the same with ad copy headlines, primary text, and hooks.
Once you have those files, the analysis does not have to be manual. Drop the keyword CSV into ChatGPT or Claude and ask it to identify the fastest-growing clusters, group keywords by category, and surface the top 10 to 20 candidates worth testing based on growth velocity and recency. Give it the creative hook data alongside the keyword data and ask it to find patterns in what the top-performing hooks have in common.
This turns a research session that would take several hours into something you can complete in under 30 minutes. You are not outsourcing the judgment call. You are outsourcing the pattern recognition across a table of 200-plus rows so you can focus on the handful of angles worth acting on.
The research covers one domain. You can repeat the exact same process on the second and third highest-volume domains in the list. Each one will show you a slightly different slice of what is working in the space right now, and cross-referencing keyword growth signals across multiple feed domains gives you a much more confident picture before you spend a single dollar testing.
Pro Tips for Getting the Most Out of This Research
Look beyond the top domain. Visymo had the most raw volume during this research, but that also means more operators are watching it. The second and third most active domains often surface keyword opportunities that are less saturated and equally valid as starting points.
Zero-history keywords are your best leads. When a keyword shows no comparison data, it means the campaign launched inside the last 30 days. If it is already ranking near the top by active ad count, that is a very strong signal. You have a short window to move on it before others do.
Pay attention to creative recency more than creative count. A creative with 90 active ads after 14 days is more interesting than one with 400 active ads after 140 days. The older one has already done the hard work of proving the angle. The newer one tells you what is working right now, in the current traffic environment, with today's audience.
Combine keyword signals with hook analysis. The hooks table downloadable from the creative detail view shows you what opening lines are being used most across active campaigns. Cross-referencing which hooks appear most in your fastest-growing keyword categories gives you a creative brief that is grounded in actual performance data rather than intuition.
FAQs: Finding Search Arbitrage Keywords With Ad Intelligence
What is search arbitrage and how does it work on Meta?
Search arbitrage is a traffic monetization model where you buy paid traffic on a platform like Meta and send it to a landing page that contains a search widget. When visitors click on the sponsored search results on that page, you earn a revenue share from the search feed provider. Profit comes from paying less per click on Meta than you earn per click on the feed. The margin has compressed significantly in recent years, which is why keyword and creative selection matters more than it used to.
Why is ad volume a useful signal for finding profitable keywords?
You cannot see revenue or margin data from outside someone else's campaign. But you can see how many ads they are running and whether that number is growing or shrinking. Operators who are scaling a keyword are doing so because it is generating positive returns. When multiple operators are all growing their ad count on the same keyword phrase over the same 30-day window, that is a reasonable proxy for profitability, even without direct access to their numbers.
How often should I run this keyword research?
The search arb space moves quickly. A keyword that is exploding in growth this week may be flooded with competition in three weeks. Running this analysis weekly gives you a meaningful edge. The period-over-period comparison in AdPlexity Social makes it easy to spot what changed since your last research session.
Do I need to be an experienced search arb operator to use this workflow?
Not at all. The workflow is structured around reading a few specific signals: is ad volume growing or shrinking, how new is the campaign, and how many active ads does the creative have. Those are concrete numbers, not nuanced judgments. Someone new to the space can follow this process and walk away with a list of keyword and creative angles that are grounded in real data rather than guesswork.
What is the difference between the Strength score and sorting by new ads?
The Strength score is a composite metric that weighs total ad volume, new ads in the current period, and how long campaigns have been running. It gives you a balanced view of overall keyword health. Sorting by new ads in the last 30 days gives you a raw momentum signal: where is fresh spend being deployed right now. For finding new opportunities to test, sorting by new ads is usually the better starting point. The Strength score is more useful for confirming that a keyword has a sustained performance history behind it.
Can I use this workflow to research specific feed providers, or just domains?
You can filter the Domain view by the Search Arbitrage vertical and see activity broken down by identified feed providers like Visymo and Tonic, as well as an Unknown category for domains that are identified as search arb but not attributed to a named feed. The keyword and creative data is available at the domain level for any of these, so you can run the same analysis across whichever feed providers you are considering working with.
Does AdPlexity Social show performance data like RPM or click-through rate?
No. AdPlexity Social does not show revenue data, RPM, or click-through rates. What it shows is ad volume, creative deployment patterns, active ad counts, run duration, and period-over-period growth. These are behavioral signals, not financial metrics. The inference about profitability comes from reading those behavioral signals, not from direct access to anyone's campaign numbers.
Conclusion
The search arbitrage space is harder than it was two years ago. That is not going to change. But operators who are still making it work are still scaling, still deploying ads at volume, and still leaving a clear footprint in the data.
The workflow above gives you a systematic way to find that footprint before you spend anything on testing. Start with the highest-volume feed domains in AdPlexity Social, drill into the Arbitrage Keywords view sorted by new ad growth, flag the zero-history keywords with early momentum, and cross-reference the creatives being deployed against those keywords to find angles that are fresh enough to still be viable.
You are not copying anyone's campaign. You are starting your research from a position of real market intelligence instead of a blank screen.
Sign up at adplexity.io and run this search yourself. The data is there. Most of your competitors are not looking at it this way.
Key Takeaways
The search arbitrage space is more competitive than ever, but operators who are still profitable are leaving clear signals in the data. AdPlexity Social's Domain analytics and Arbitrage Keywords views let you see exactly which keywords are growing in ad volume right now, which creatives are being deployed most aggressively, and how recently those campaigns launched. You don't need to guess. The data tells you where the money is moving.
If you run search arbitrage on Meta, you already know the last 12 months have been brutal. RPMs have compressed. Traffic quality filters are stricter. The operators who used to print money on autopilot are now grinding for margins they can barely defend. And if you are just getting started, you are walking into a space where the low-hanging fruit has already been picked.
But here's the thing: some people are still making it work. The proof is sitting right in the ad data.
When a search arb operator is scaling a keyword, they do not do it quietly. They deploy ads in volume. Tens of ads, sometimes hundreds, pointing at the same landing page, the same feed, the same keyword phrase. And when that volume is growing week over week, it is about as close to a profitability signal as you can get without seeing their revenue dashboard.
This post walks you through exactly how to read those signals using AdPlexity Social, from identifying which feed domains are the most active right now to drilling into specific keywords that are growing fastest, to finding fresh creatives you can use as a starting point for your own tests.
Whether you are a seasoned operator trying to find your next scalable angle, or someone just getting started and trying to avoid burning budget on dead keywords, this workflow gives you a research foundation that most people in the space are not using.
Watch the video:
Why Ad Volume Is the Closest Proxy You Have to Profitability
Search arbitrage research comes with a fundamental problem: you cannot see anyone's revenue numbers. Cost per click, RPM, net margin — none of that is visible from the outside. What you can see is behavior.
When an operator finds a keyword that converts, they scale it. They launch more ads, test more creatives, and push more traffic to the same feed. That behavior shows up as ad volume. And when you can see that ad volume growing from one period to the next, you are watching someone double down on something that is working.
That is the core logic behind this entire workflow. You are not reverse-engineering profitability directly. You are finding the footprint that profitable campaigns leave behind.
AdPlexity Social indexes Meta ads at a rate of 15 million new ads per month, with over 100 million ads in the database. In the search arbitrage vertical, that coverage is dense enough that you can identify which feed domains are seeing the most activity, which keyword phrases are attracting the most new ad spend, and which creatives are being used across the most active campaigns, all without any guesswork.
Step 1: Start With the Domain Dimension to Find the Most Active Feeds
The first thing you want to do is not browse ads. Most people open a spy tool and start scrolling through individual creatives, which gives you a surface-level view with no context. Instead, go straight to the Domains tab inside AdPlexity Social.
Filter by the Search Arbitrage industry. This narrows the domain list down to advertisers whose landing pages and redirect chains are identified as search feed traffic. What you get is a ranked list of domains by ad activity, showing you which feed domains have the highest volume of ads pointing at them right now.
At the time of this research, Visymo was the clear leader in terms of 30-day ad volume with 257,000 ads deployed in that window. The Unknown category, meaning domains that AdPlexity identifies as search arb but cannot attribute to a named feed, came in at 161,000. Tonic sat around 80,000.
The gap between Visymo and Tonic is significant. When one feed domain is attracting more than three times the ad volume of another, that tells you something meaningful about where operators are finding better monetization right now.
From the domain list, pick the highest-activity domain and click through to its detail view. This is where the real research starts.
Step 2: Navigate to Arbitrage Keywords and Sort by Growth
Inside the domain detail view, you have several analytics options. Skip the Verticals breakdown for now. It gives you a high-level category split, but it does not tell you what you actually need to know at this stage.
Go directly to the Arbitrage Keywords tab.
This is where AdPlexity Social surfaces the specific keyword phrases being used in ads pointing to this domain. Each keyword comes with data on total ads, new ads in the last 30 days, active ads at the moment of your search, and a comparison against the previous 30-day period.
You have two main sorting options. You can sort by the Strength score, which is an algorithm that combines total ad count, new ad volume, and how long those ads have been running. Or you can sort by new ads in the last 30 days, which gives you a raw momentum signal: where is fresh spend being deployed right now?
For a first pass, sort by new ads. This surfaces the keywords that are actively being scaled at this moment, not necessarily the ones with the most historical volume.
Step 3: Read the Signals — Growing vs. Declining Keywords
Once you have the keyword list sorted by new ad volume, the period-over-period comparison column is the most important thing on the screen.
A positive number means the ad volume on that keyword grew from the previous 30-day period to the current one. A negative number means it shrank. And when a keyword shows no comparison figure at all, it means there is no data from the previous period, which usually means the campaign is less than 30 days old.
Growing fast is the primary signal you are looking for. In the Visymo data, there were keywords that jumped from 31 ads in the previous period to 849 in the current one. That kind of growth does not happen by accident. Someone tested it, it worked, and they scaled.
The keywords showing declines are equally informative. If a keyword had 2,400 ads and is now shrinking, that usually means one of two things: either the competition crowded it out, or the monetization dropped and the operator pulled back. Either way, it is not where you want to start testing.
The zero-history keywords, the ones with no prior-period comparison because they launched in the last 30 days, are arguably the most interesting data points in the list. During this research, keywords like facial rejuvenation clinics went from 1 ad to 447 with no previous data. Keywords in food and beverage operations and B2B automation categories were showing similar explosive early growth.
That kind of signal, brand new with fast early momentum, is what you are hunting for.
Step 4: Cross-Reference Creatives to Find Fresh Angles
Knowing which keywords are growing is one half of the research. The other half is understanding how people are advertising against those keywords. That is where the Creatives view comes in.
From the same domain detail view, navigate to Creatives and click View All Creatives. This surfaces the image and video creatives being deployed most aggressively across ads pointing to this domain, sorted by active ad count and new ad volume.
What you are looking for here is a combination of signals, not a single metric. You want creatives with a high number of active ads, a good number of new ads in the recent period, and a relatively short run time. That last point matters more than most people realize.
A creative running 141 days with 2,400 total ads has almost certainly been seen by a large chunk of the relevant audience already. The competitive density around it is high. Launching something similar now carries real risk that you are walking into a saturated angle.
But a creative running 9 or 14 days, showing up near the top of the active-ads ranking with no prior-period data? That is a different story entirely. During this walkthrough, there were several creatives in exactly that position, including one related to automation equipment and another tied to industrial electrical content, both under 14 days old and already sitting among the top performers by active ad count.
The practical move here is not to copy these creatives. It is to understand the category and angle they represent, then build your own version targeting the same keyword. If "automation equipment manufacturer" is generating active search arb traffic right now, you want a creative that fits that query intent, not the exact image someone else is running.
Step 5: Export the Data and Let AI Do the Heavy Lifting
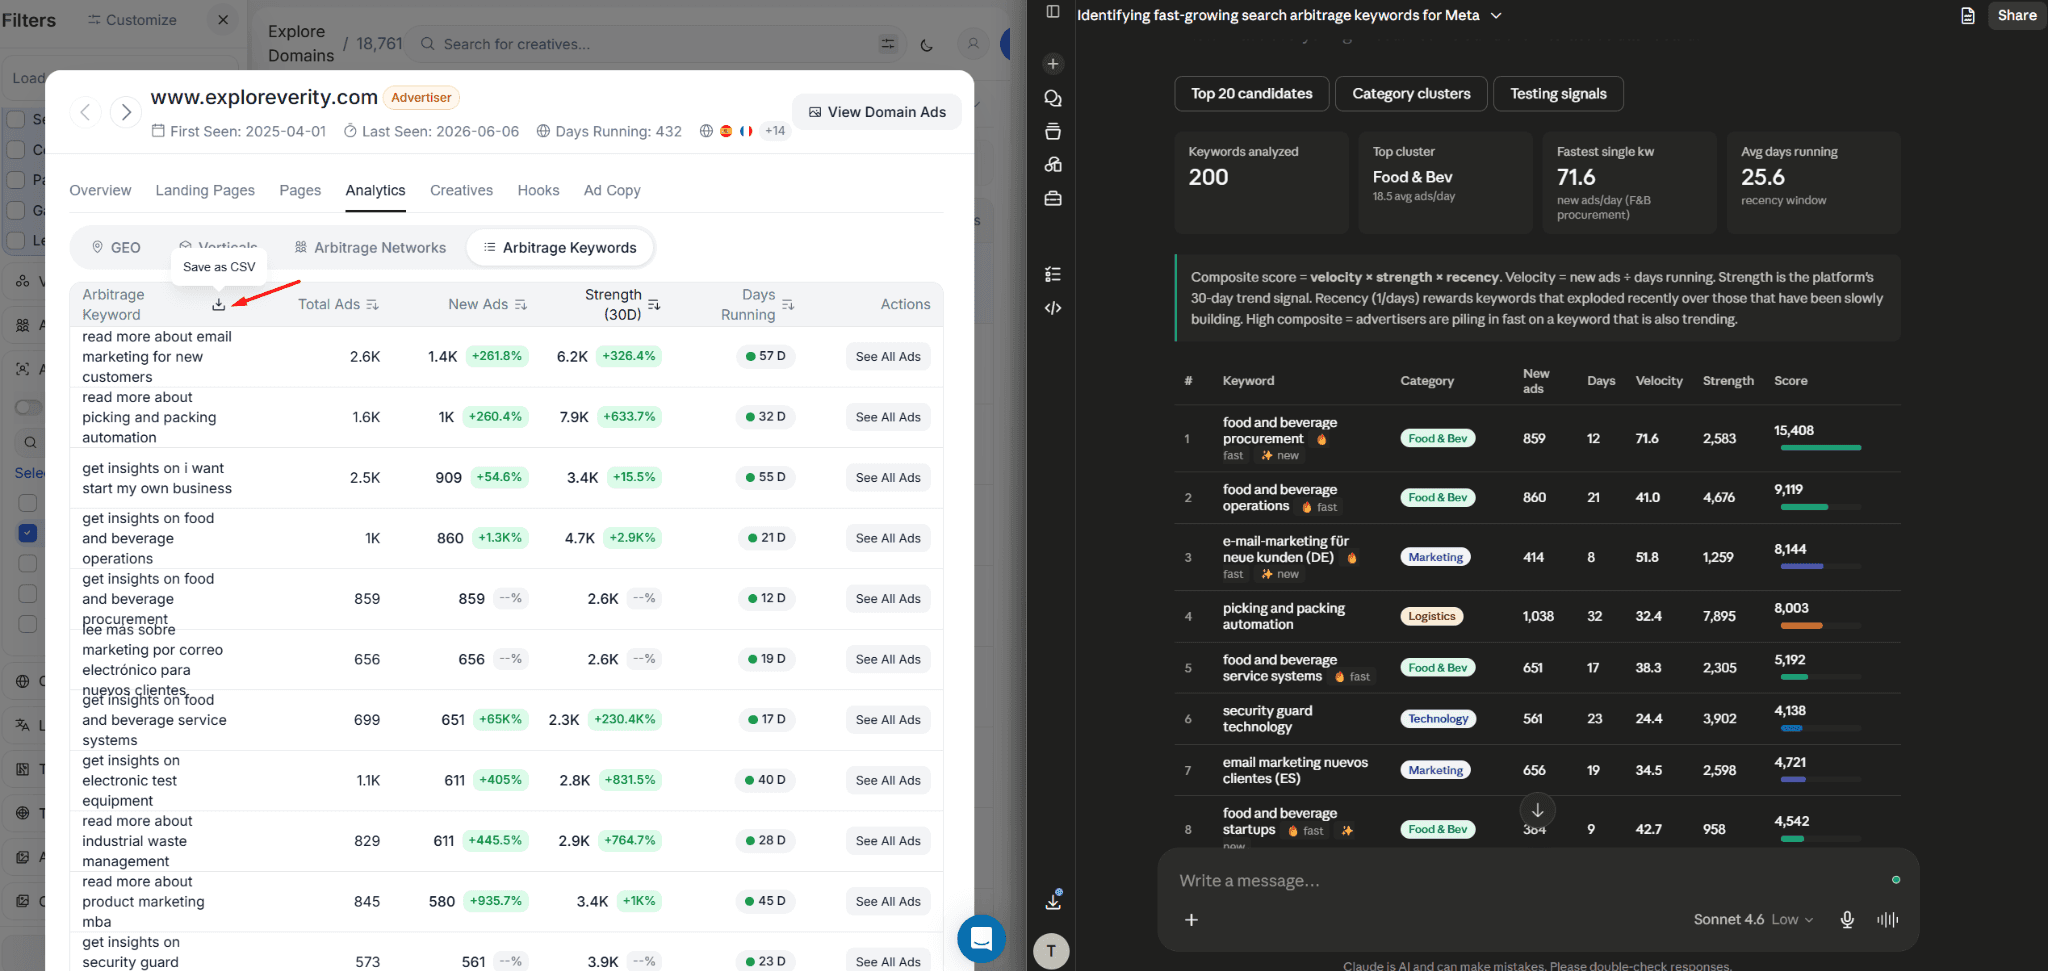
One of the more underused features in this workflow is the ability to download the Arbitrage Keywords table as a CSV. You can do the same with ad copy headlines, primary text, and hooks.
Once you have those files, the analysis does not have to be manual. Drop the keyword CSV into ChatGPT or Claude and ask it to identify the fastest-growing clusters, group keywords by category, and surface the top 10 to 20 candidates worth testing based on growth velocity and recency. Give it the creative hook data alongside the keyword data and ask it to find patterns in what the top-performing hooks have in common.
This turns a research session that would take several hours into something you can complete in under 30 minutes. You are not outsourcing the judgment call. You are outsourcing the pattern recognition across a table of 200-plus rows so you can focus on the handful of angles worth acting on.
The research covers one domain. You can repeat the exact same process on the second and third highest-volume domains in the list. Each one will show you a slightly different slice of what is working in the space right now, and cross-referencing keyword growth signals across multiple feed domains gives you a much more confident picture before you spend a single dollar testing.
Pro Tips for Getting the Most Out of This Research
Look beyond the top domain. Visymo had the most raw volume during this research, but that also means more operators are watching it. The second and third most active domains often surface keyword opportunities that are less saturated and equally valid as starting points.
Zero-history keywords are your best leads. When a keyword shows no comparison data, it means the campaign launched inside the last 30 days. If it is already ranking near the top by active ad count, that is a very strong signal. You have a short window to move on it before others do.
Pay attention to creative recency more than creative count. A creative with 90 active ads after 14 days is more interesting than one with 400 active ads after 140 days. The older one has already done the hard work of proving the angle. The newer one tells you what is working right now, in the current traffic environment, with today's audience.
Combine keyword signals with hook analysis. The hooks table downloadable from the creative detail view shows you what opening lines are being used most across active campaigns. Cross-referencing which hooks appear most in your fastest-growing keyword categories gives you a creative brief that is grounded in actual performance data rather than intuition.
FAQs: Finding Search Arbitrage Keywords With Ad Intelligence
What is search arbitrage and how does it work on Meta?
Search arbitrage is a traffic monetization model where you buy paid traffic on a platform like Meta and send it to a landing page that contains a search widget. When visitors click on the sponsored search results on that page, you earn a revenue share from the search feed provider. Profit comes from paying less per click on Meta than you earn per click on the feed. The margin has compressed significantly in recent years, which is why keyword and creative selection matters more than it used to.
Why is ad volume a useful signal for finding profitable keywords?
You cannot see revenue or margin data from outside someone else's campaign. But you can see how many ads they are running and whether that number is growing or shrinking. Operators who are scaling a keyword are doing so because it is generating positive returns. When multiple operators are all growing their ad count on the same keyword phrase over the same 30-day window, that is a reasonable proxy for profitability, even without direct access to their numbers.
How often should I run this keyword research?
The search arb space moves quickly. A keyword that is exploding in growth this week may be flooded with competition in three weeks. Running this analysis weekly gives you a meaningful edge. The period-over-period comparison in AdPlexity Social makes it easy to spot what changed since your last research session.
Do I need to be an experienced search arb operator to use this workflow?
Not at all. The workflow is structured around reading a few specific signals: is ad volume growing or shrinking, how new is the campaign, and how many active ads does the creative have. Those are concrete numbers, not nuanced judgments. Someone new to the space can follow this process and walk away with a list of keyword and creative angles that are grounded in real data rather than guesswork.
What is the difference between the Strength score and sorting by new ads?
The Strength score is a composite metric that weighs total ad volume, new ads in the current period, and how long campaigns have been running. It gives you a balanced view of overall keyword health. Sorting by new ads in the last 30 days gives you a raw momentum signal: where is fresh spend being deployed right now. For finding new opportunities to test, sorting by new ads is usually the better starting point. The Strength score is more useful for confirming that a keyword has a sustained performance history behind it.
Can I use this workflow to research specific feed providers, or just domains?
You can filter the Domain view by the Search Arbitrage vertical and see activity broken down by identified feed providers like Visymo and Tonic, as well as an Unknown category for domains that are identified as search arb but not attributed to a named feed. The keyword and creative data is available at the domain level for any of these, so you can run the same analysis across whichever feed providers you are considering working with.
Does AdPlexity Social show performance data like RPM or click-through rate?
No. AdPlexity Social does not show revenue data, RPM, or click-through rates. What it shows is ad volume, creative deployment patterns, active ad counts, run duration, and period-over-period growth. These are behavioral signals, not financial metrics. The inference about profitability comes from reading those behavioral signals, not from direct access to anyone's campaign numbers.
Conclusion
The search arbitrage space is harder than it was two years ago. That is not going to change. But operators who are still making it work are still scaling, still deploying ads at volume, and still leaving a clear footprint in the data.
The workflow above gives you a systematic way to find that footprint before you spend anything on testing. Start with the highest-volume feed domains in AdPlexity Social, drill into the Arbitrage Keywords view sorted by new ad growth, flag the zero-history keywords with early momentum, and cross-reference the creatives being deployed against those keywords to find angles that are fresh enough to still be viable.
You are not copying anyone's campaign. You are starting your research from a position of real market intelligence instead of a blank screen.
Sign up at adplexity.io and run this search yourself. The data is there. Most of your competitors are not looking at it this way.
Table of Contents
Quickly navigate through the key sections of this article.
Discover Winning Meta Ads
Similar Blogs
Check related blogs
Check related blogs
Check related blogs


Ready to See What’s Really Working on Meta?
Adplexity
Social
© Copyright 2026 All Rights Reserved
Ready to See What’s Really Working on Meta?
Adplexity
Social
© Copyright 2026 All Rights Reserved
Ready to See What’s Really Working on Meta?
Adplexity
Social
© Copyright 2026 All Rights Reserved